
Figure 3. Distribution of var transcripts by their encoded N‐terminal CIDR domain type within individual patients.
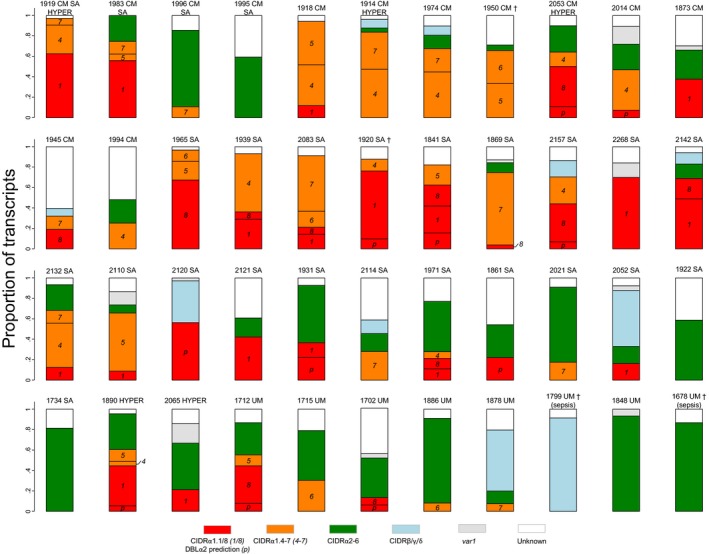
Patient numbers and diagnoses cerebral malaria (CM), severe anaemia (SA), hyperparasitemia (HYPER) and uncomplicated malaria (UM). Patients who died are indicated with (†). Red: CIDRα1.[1/8] or DBLα2 prediction (DC8, binds EPCR), orange: CIDRα1.[4–7] (group A, binds EPCR), green: CIDRα2‐6 (group B/C, binds CD36), blue: CIDRβ/γ/δ (group A, unknown binding phenotype), grey: var1, white: CIDR type not identified.