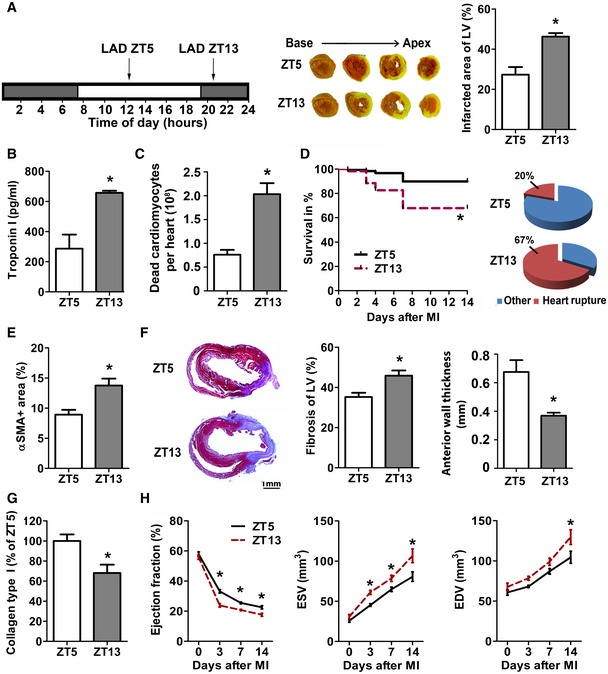
Permanent LAD occlusion was performed at ZT5 or ZT13. TTC staining (white, infarct; red, vital myocardium) and quantification of infarct size normalized to the left ventricle (LV). Student's t‐test; n = 4 mice for ZT5 and n = 5 for ZT13 MI; *P = 0.0041.
Plasma troponin I levels 24 h after MI. Student's t‐test; n = 4 mice for ZT5 and n = 5 for ZT13 MI; *P = 0.0007.
Flow cytometric analysis of dead cardiomyocytes (CD45−, Zombie+) 24 h after MI. Student's t‐test; n = 3 mice in both groups; *P = 0.0072.
Survival rates after MI and cause of death. Log‐rank test; n = 87 mice in both groups; *P = 0.0006.
Myofibroblasts within infarcts were quantified by alpha‐smooth muscle actin (αSMA) staining as ratio between stained and total area of random fields. Student's t‐test; n = 4 mice in both groups; *P = 0.0134.
Masson's trichome staining of fibrosis (blue, collagen; red, vital myocardium) and quantification relative to total LV (*P = 0.0095) as well as LV anterior wall thickness (*P = 0.0068) 7 days after MI. Student's t‐test; n = 6 mice for ZT5 and n = 7 for ZT13 MI.
Analysis of relative collagen type I content identified by Sirius Red staining 7 days after MI. Student's t‐test; n = 4 mice for ZT5 and n = 5 for ZT13 MI; *P = 0.0175.
Echocardiographic assessment of ejection fraction (EF), end‐systolic volume (ESV), and end‐diastolic volume (EDV). Two‐way ANOVA; n = 6 mice for no MI for both groups, n = 6 for ZT5 and n = 9 for ZT13 at 72 h post‐MI, n = 8 for both groups at 7 days post‐MI, and n = 7 for ZT5 and n = 5 for ZT13 at 14 days post‐MI; ZT5 versus ZT13: *P = 0.0001 (EF, 3 days), *P = 0.0042 (EF, 7 days), *P = 0.0121 (EF, 14 days); *P = 0.0253 (ESV, 3 days), *P = 0.0421 (ESV, 7 days), *P = 0.0005 (ESV, 14 days); *P = 0.0053 (EDV, 14 days).
Data information: All data are expressed as mean ± SEM.