
Figure 3. Fstl1 deletion in S100a4cre+ × Fstl1flox/flox mice.
Genotypes are indicated as WT for S100a4cre−/− × Fstl1flox/flox mice and cfKO for S100a4cre+/− × Fstl1flox/flox.
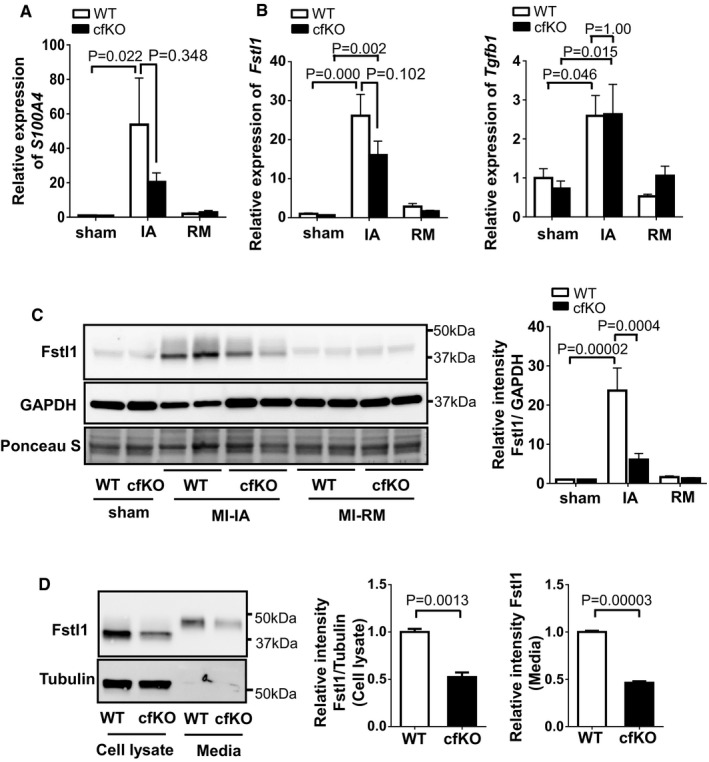
- S100a4 expression is induced in the ischemic area (IA). qPCR analysis of mRNA expression of S100a4 in ischemic heart and sham‐operated heart of WT mice and cfKO mice. Heart samples were harvested at 7 days after the surgery. Statistical analysis was performed by two‐way ANOVA. Post hoc test was performed by Tukey's test. Error bars represent mean ± SEM (n = 16 and 15 for WT and cfKO sham group, n = 15 and 14 for WT and cfKO MI group, respectively).
- qPCR analysis of mRNA expression of Fstl1 and Tgfβ1 in sham and post‐MI heart. Error bars represent mean ± SEM (n = 16 and 15 for WT and cfKO sham group, n = 15 and 14 for WT and cfKO MI group, respectively). Statistical analysis was performed by two‐way ANOVA. Post hoc test was performed by Tukey's test.
- Western blot analysis of Fstl1 protein expression in ischemic and sham‐operated hearts at day 7 after the surgery. Quantified values of Fstl1 protein in WT and cfKO mouse hearts normalized by GAPDH band intensity are shown. Statistical analysis was performed by two‐way ANOVA. Post hoc test was performed by Tukey's test. Error bars represent mean ± SEM (n = 5 for each sham group and n = 6 for each MI group).
- Fstl1 protein expression in isolated cardiac fibroblasts from cfKO and littermate WT neonatal mice. Cell lysate and its media from cells cultured for 24 h without FBS were assessed by Western blotting. Error bars represent mean ± SEM (n = 3 per group). Statistical analysis was performed by unpaired t‐test (two‐tailed). The experiments were performed twice independently.