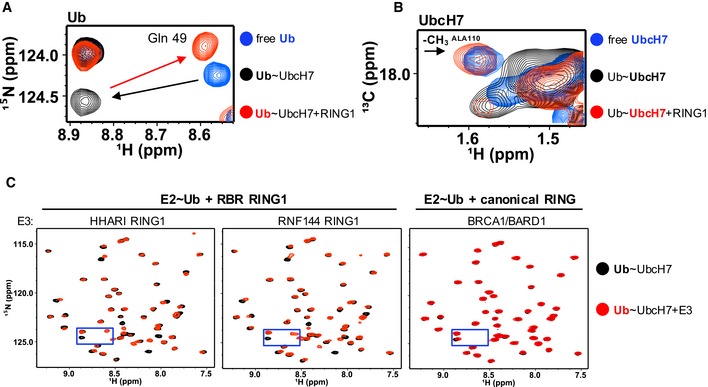
Figure 3. HHARI RING1 disfavors closed E2~Ub conformations.

- Region of 1H‐15N‐HSQC‐TROSY spectra that contains Gln49 Ub resonance is overlaid: free 15N‐Ub (blue), UbcH7‐O‐15N‐Ub (black), and HHARI RING1‐bound UbcH7‐O‐15N‐Ub (red). Black arrow highlights perturbation upon conjugation to UbcH7 and red arrow highlights perturbation of conjugated Ub upon HHARI RING1 binding to UbcH7.
- Region of 1H‐13C‐HSQC spectra of 13C‐UbcH7 (blue), 13C‐UbcH7‐O‐Ub (black), and HHARI RING1‐bound 13C‐UbcH7‐O‐Ub (red) that includes the methyl (13 CH 3) resonance of the surface‐exposed UbcH7 crossover helix residue, Ala110 (black arrow), is shown. The 13 CH 3 peak of Ala110 either broadens dramatically or shifts to an unknown position in the spectrum of 13C‐UbcH7‐O‐Ub (black) in the presence of HHARI RING1 it reappears at its position in free UbcH7, consistent with disruption of closed UbcH7˜Ub conformations. Pairwise overlays and larger spectra are provided in Appendix Fig S3.
- Regions of 1H‐15N‐HSQC‐TROSY spectra of UbcH7‐O‐15N‐Ub in the absence (black) and presence (red) of a RING1 domain from the RBR E3s HHARI (left) or RNF144 (middle) or a canonical RING domain of BRCA1/BARD1 (right). The perturbations on Ub due to binding of HHARI RING1 and RNF144 RING1 are remarkably similar, while binding of the canonical RING domain of BRCA1/BARD1 has no observable effect on the Ub spectrum. Blue boxes mark area expanded in (A).
