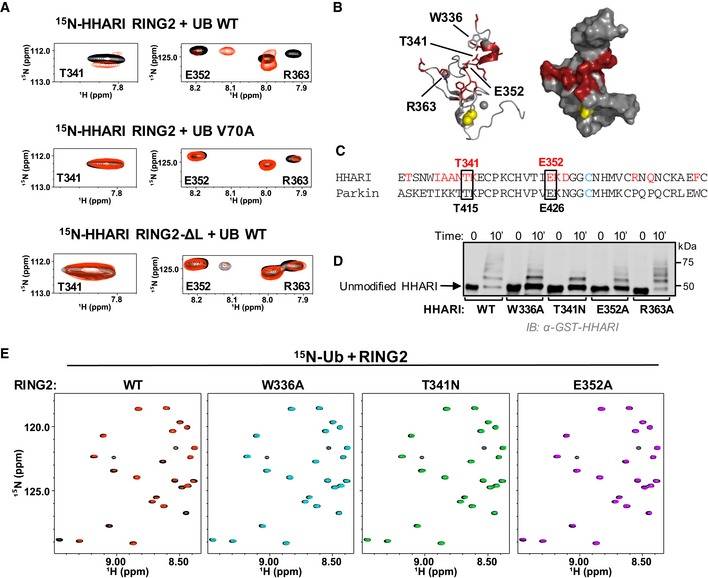
Top panel: Regions of 1H‐15N‐HSQC‐TROSY spectra of 15N‐HHARI RING2 in the absence (black) and presence (red) of excess Ub. Middle panel: Identical spectral region, but in the presence of Ub‐V70A (red). Bottom panel: Identical spectral region, but spectra are from a truncated HHARI RING2 construct that lacks linker residues 325–335 (HHARI RING2‐ΔL).
Residues with CSPs > 1 stdv (HHARI residues 333, 337–342, 352–354, 363, 365, 371) are colored red in a cartoon (left) and surface (right) representation of HHARI RING2 (PDB 2m9y). The active site C357 is shown in yellow.
CLUSTAL OMEGA sequence alignment of HHARI and Parkin RING2 domains. HHARI residues perturbed by Ub binding (A) are in red. HHARI residues that are conserved in Parkin and that decrease auto‐ubiquitination activity when mutated in HHARIRBR are indicated with black boxes.
Mutations in the Ub‐binding surface of RING2 decrease activity in E3 auto‐ubiquitination assays. Time points (10 min) are visualized by Western blotting for the GST‐tag on HHARI. Relative activity of HHARI WT and mutant forms is clearest when the intensity of the unmodified HHARI band is compared.
1H‐15N‐HSQC‐TROSY spectra of 15N‐Ub demonstrate binding by WT‐HHARI RING2, but not by mutant HHARI RING2 constructs that exhibit decreased auto‐ubiquitination activity. Overlay of 15N‐Ub spectra in the absence (black) and presence of WT‐HHARI RING2 (red), W336A‐HHARI RING2 (blue), T341N‐HHARI RING2 (green), or E352A‐HHARI RING2 (purple). HHARI mutations that exhibited reduced binding to Ub also show decreased ubiquitination activity in (D).

