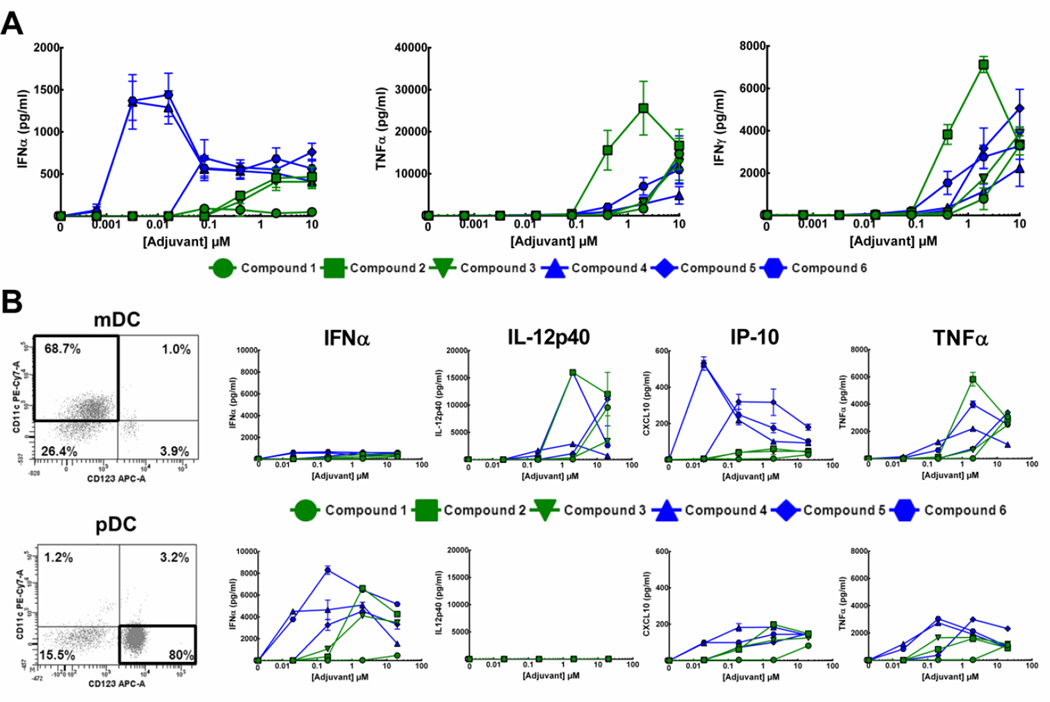
Figure 4. Production of cytokines in response to TLR7/8 agonists.
A) PBMCs isolated from whole blood collected from healthy donors were subjected to treatment with increasing concentrations (0.0032, 0.016, 0.08, 0.4, 2 or 10 µM) of different agonists for 24 h. Post-treatment, cell culture supernatants were collected and subjected to a Luminex xMAP bead-based assay (Affymetrix Panomics) for several different cytokines. Graphs are average of three replicates from 3 different donors ± SEM. B) mDCs (top) or pDCs (bottom) isolated from hPBMCs were treated with increasing concentrations (0.02, 0.2, 2 or 20 µM) of agonists for 24 h. Post-treatment, cell culture supernatants were collected and subjected to a Luminex xMAP bead-based assay (Affymetrix Panomics) for several different cytokines. Dot plots of CD11c+/CD123− (mDC, top) or CD11c−/CD123+ (pDC, bottom) cells not treated with agonists, from a representative experiment, are shown at left. Graphs are average of two technical replicates from a single donor but are representative of three individual experiments from different donors.

