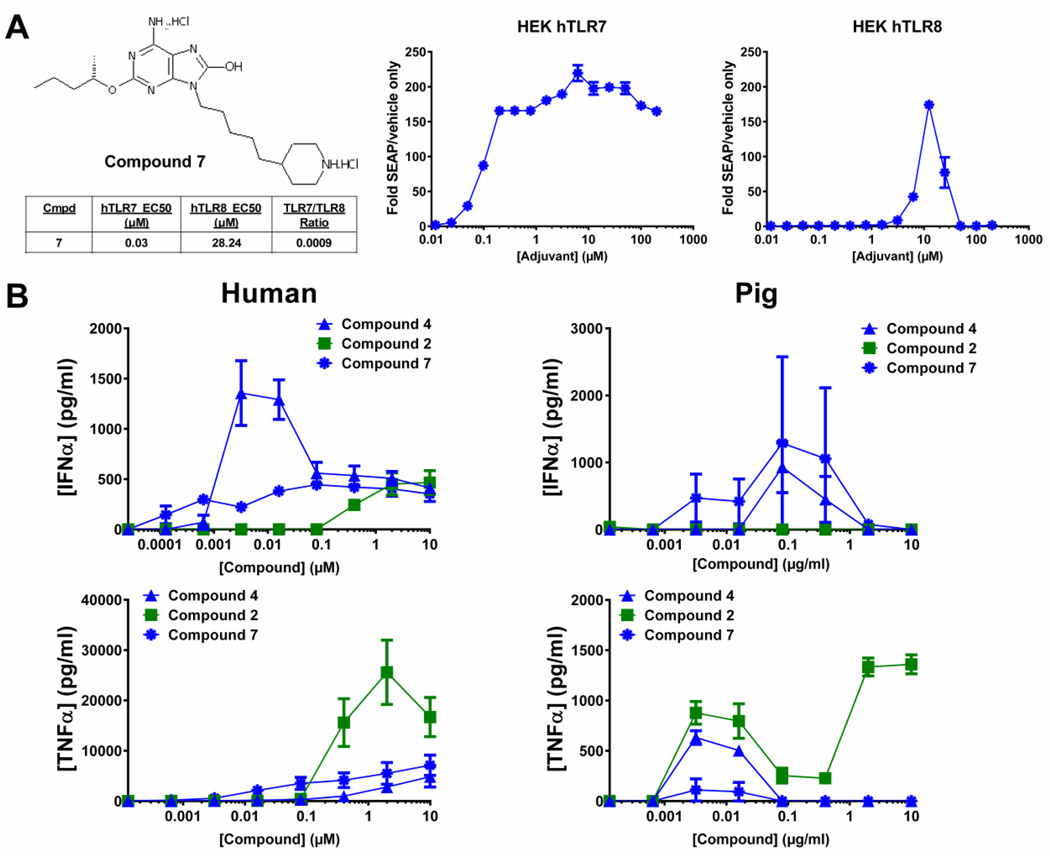
Figure 5. Cytokine production in response compound 2, compound 4 and compound 7 from pig or human PBMCs.
A) Structure of compound 7, left, and HEK hTLR7 or hTLR8 cell response to compound 7, right. HEK hTLR7 or hTLR8 cells were subjected to treatment with increasing concentrations of compound 7 followed by determination of relative NF-κB activity versus control using a QuantiBlue colorimetric assay. Graphs represent three separate experiments ± SEM. EC50 in each cell line, outlined under structure, was determined by non-linear curve fitting. B) PBMCs from each indicated species were subjected to treatment with increasing concentrations of compounds 2, 4 or 7 for 24 h followed by assessment of IFNα and TNFα cytokine production from supernatants by ELISA. Human PBMC graphs represent average response from three separate donors ± SEM. Pig PBCM graphs represent average response from two replicates ± SD.

