
Figure 3. Maintenance of non-parenchymal macrophages in adulthood.
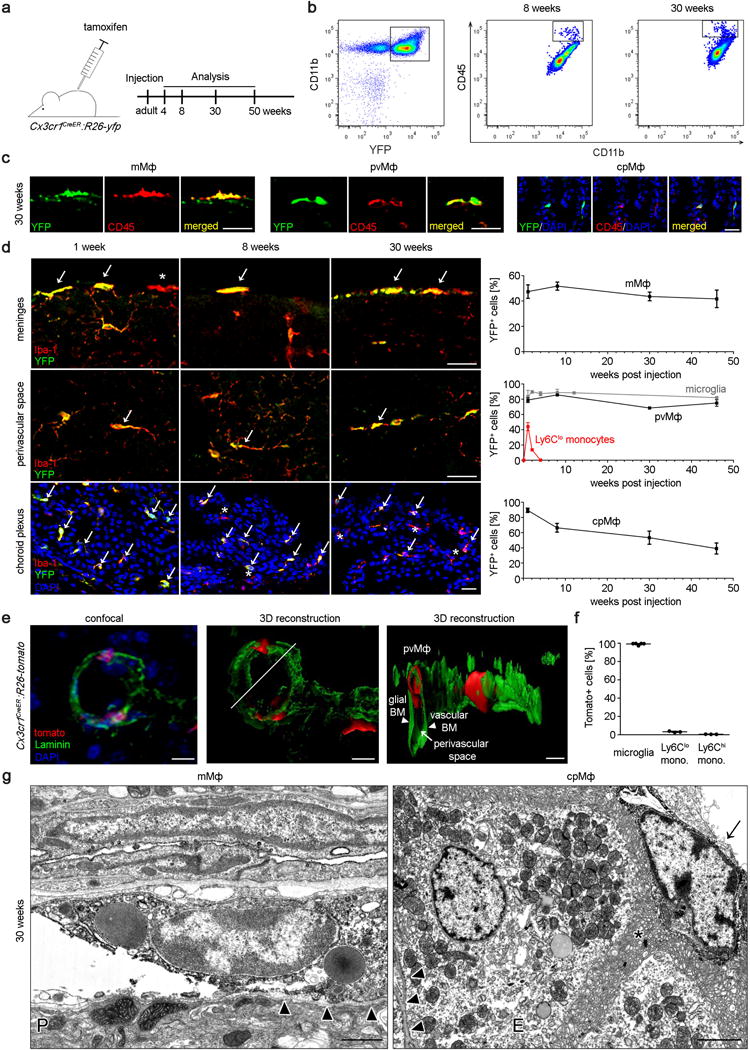
a) Scheme and time line for labelling and analyses of pvMΦ, mMΦ and cpMΦ in adulthood using TAM injection in adult Cx3cr1CreER:R26-yfp animals.
b) Persistence of labelled yfp+CD11b+CD45hi macrophages in adult Cx3cr1CreER:R26-yfp mice. Representative flow cytometric images of five investigated mice are displayed.
c) Representative immunofluorescence for yfp (green), CD45 (red) and DAPI (blue) in pvMΦ, mMΦ and cpMΦ in adult Cx3cr1CreER:R26-yfp mice 30 weeks after TAM application. Scale bars = 25 μm. At least three mice per group were analysed.
d) Kinetics of yfp labelling in Iba-1+ pvMΦ, mMΦ and cpMΦ in adult Cx3cr1CreER:R26-yfp animals upon TAM application. Left: Characteristic brain sections are shown. Scale bars = 25 μm. Right: Quantification thereof. Asterisks indicate single positive cells, arrows label double positive cells. Data represent mean ± s.e.m. of at least three mice per group.
e) Localization of tomato+pvMΦ (red) in the vascular compartment using confocal microscopy (left) and 3D-reconstruction (middle, right) in adult Cx3cr1CreER:R26-tomato animals 8 weeks after TAM injection using laminin (green) to indicate the basal lamina and nuclear staining (DAPI, blue). Arrow heads and arrow point the respective structures. Scale bars = 10 μm, (overview), 5 μm (zoom). Three mice were investigated and typical pictures are shown.
f) Quantification of tomato labelling 8 weeks after TAM application. Data represent mean ± s.e.m. of at least three mice per group.
g) Immuno-EM for yfp in Cx3cr1CreER:R26-yfp animals 30 weeks after TAM application reveals positively labelled mMΦ and cpMΦ. Arrow heads point the basal lamina. Arrow indicates Kolmer’s epiplexus cell. Asterisk designates microvilli of the choroid plexus epithelium. E = epithelium. Scale bar1 = 1 μm (left) 2 μm (right).
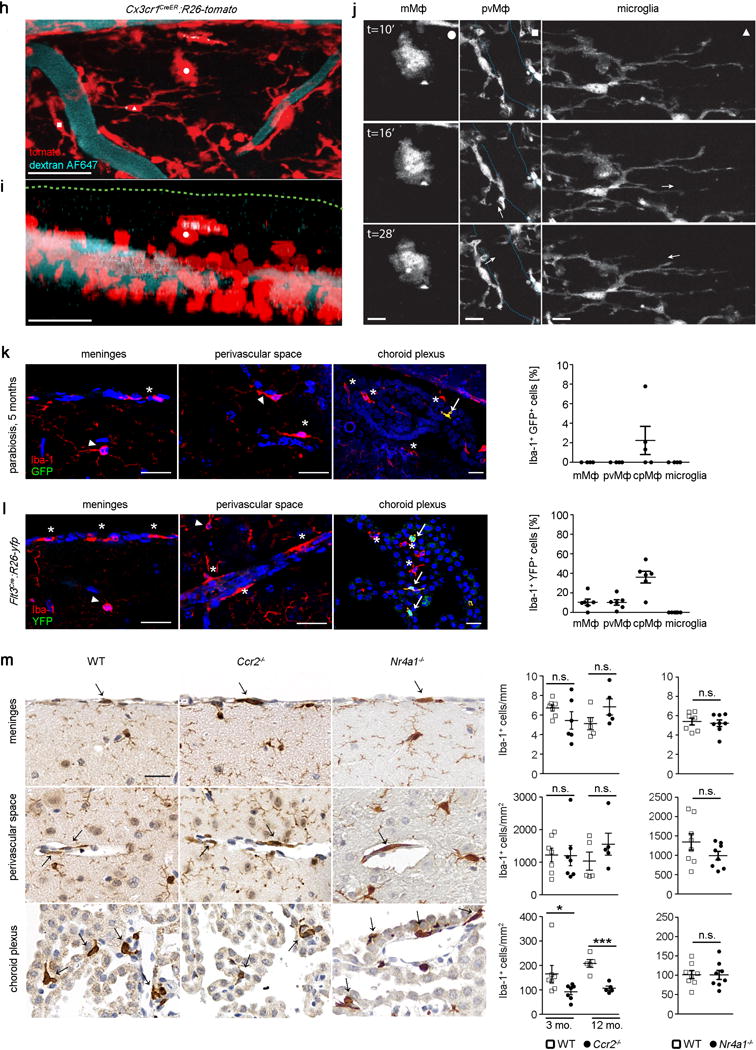
h) Confocal projection of the dorsal spinal surface of a Cx3cr1CreER:R26-tomato mice (tomato, red) at 8 weeks after TAM and injected with dextran-AF647 (blue) to reveal the vasculature. An example of a pvMΦ was marked by a white square, a microglial cell by a white triangle, and a mMΦ by a white circle. Scale bar = 25 μm.
i) Z-projection of the confocal image stack shown in (h) that illustrates the localization of the different myeloid cell populations. Green dotted line represents upper limit of the dura membrane as inferred by in vivo staining with Nuclear-ID blue dye (not shown). Scale bar = 25 μm.
j) In vivo 2-photon time-lapse of the myeloid cells marked in illustrating the dynamic behaviour of a mMΦ (left panel), a pvMΦ (middle panel) and a microglia cell (right panels). White arrows indicate examples and direction of dynamic changes in the middle and left panels. The cyan dotted line in the middle panel indicates the outline of the vasculature. Scale bars = 1 μm, left panels; 1.2 μm, middle panels and 2.4 μm, right panels.
k) Negligible exchange of pvMΦ, mMΦ and cpMΦ in a wild-type parabiont after 5 months of parabiosis with an ActinGFP/wt mouse. Left: representative immunofluorescence pictures. Scale bar = 25 μm. Asterisks indicate single positive cells arrows label double positive cells. Right: quantification thereof. Arrow heads point to microglia. One symbol represents one mouse with quantification of a minimum of three tissue sections. Data represent means ± s.e.m. of at least three animals per group.
l) Little Flt3 expression as marker of definitive hematopoiesis in pvMΦ, mMΦ and cpMΦ in adult Flt3Cre:R26-yfp mice. Left: representative immunofluorescence pictures. Asterisks indicate single positive cells arrows label double positive cells. Arrow heads point to microglia. Scale bar = 25 μm. Right: quantification thereof. Each symbol represents one mouse with quantification of a minimum of three tissue sections. Data represent means ± s.e.m. of at least three animals per group.
m) Localization and presence of pvMΦ, mMΦ and cpMΦ in adult wild-type (WT), Ccr2−/− and Nr4a1−/− mice evaluated using Iba-1 immunohistochemistry. Representative figure are presented (left) and quantification (right). Each symbol represents one mouse with quantification of a minimum of three tissue sections. Data represent means ± s.e.m. of at least five animals per group. N.s. = not significant. Significant differences were with asterisks (*P < 0.05, ***P < 0.001).