
Figure 2.
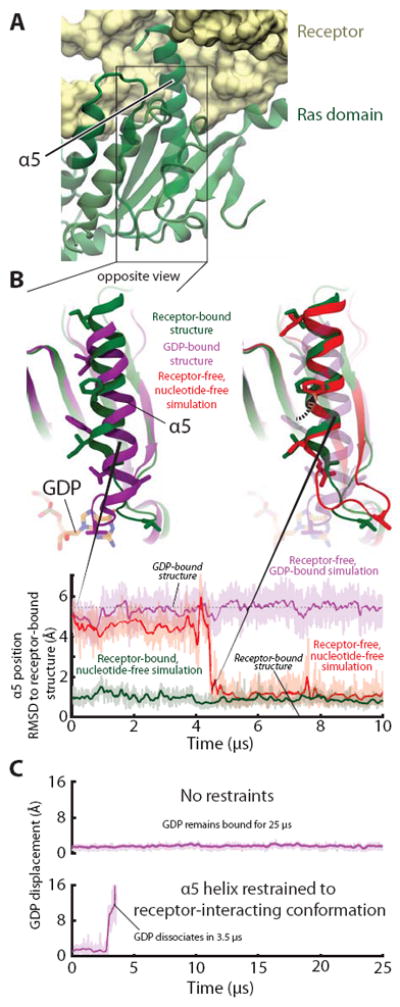
Receptor-induced displacement of the Gα C-terminal α5 helix disrupts key GDP contacts, thereby promoting nucleotide release. (A) In the receptor-bound, nucleotide-free crystal structure (PDB entry 3SN6) crystal structure, α5 docks into receptor. (B) (Top, left) Superimposition of receptor-free, GDP-bound (PDB entry 1GOT; purple) and receptor-bound, nucleotide-free (PDB entry 3SN6; green) crystal structures shows the displacement of α5, relative to the rest of the Ras domain, that occurs when a G protein binds to an activated receptor. (Top, right) In a simulation initialized from a receptor-free, GDP-bound Gt structure but with GDP removed (red), α5 spontaneously rotated 60° and translated 5 Å, adopting a position distal from the nucleotide-binding site that closely matched that of the β2AR–Gs complex (green). Several side chains in the α5 helix and α5–β6 loop are shown to facilitate comparison between structures. (Bottom) The position of α5 in this simulation (red) changed abruptly at ~4.5 μs to match that of the β2AR–Gs complex; the α5 position was stable in simulations of receptor-free, GDP-bound Gt (purple) and of the β2AR–Gs complex (green). Data are from simulations 5, 12, and 22 (Table S1). (C) Forcing α5 into the distal conformation accelerates nucleotide release in simulation. Temperature-accelerated MD simulations allow observation of GDP release on computationally accessible timescales, but only when α5 is restrained to the distal conformation (i.e., the conformation observed in the β2AR–Gs complex). Receptor-free, GDP-bound Gt was simulated without (top) or with (bottom) restraints on α5 (see SOM). GDP displacement is measured as in Fig. 1. Data are from simulations 55 and 56.