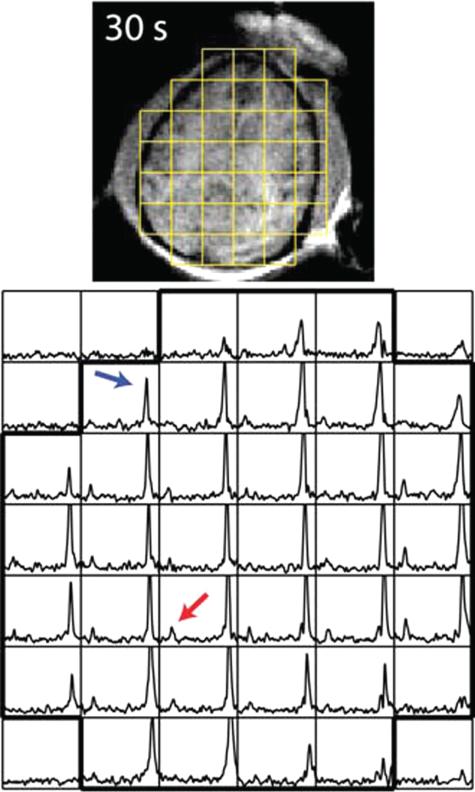
FIGURE 3.
Hyperpolarized pyruvate metabolism in the nonhuman primate brain. Pyruvate (black arrow) and its metabolic product lactate resonance (grey arrow) are detected. Top panel: 1H anatomic image with overlayed MRSI grid. Bottom panel: corresponding MRSI. Reproduced with permission from Magn Reson Med 2014; 71:19–25.

