Figure 2. Upstream regulation of p53.
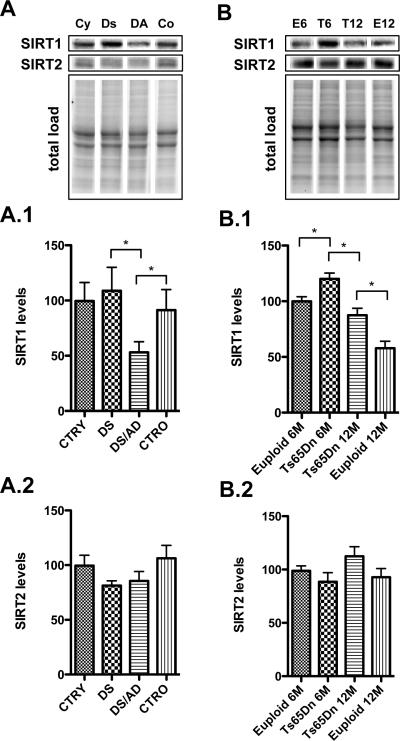
Sirtuins: SIRT1 (1) and SIRT2 (2) levels were measured by Western Blot in the frontal cortex of controls and DS cases (Panel A) and in the frontal cortex of euploid and Ts65Dn mice at 6 and 12 months of age (Panel B). Densitometric values shown in the bargraph are the mean of 8 samples per group normalized per total protein load and are given as percentage of control, set as 100%. On the top a representative blot image with protein bands is shown (*p < 0.05).

