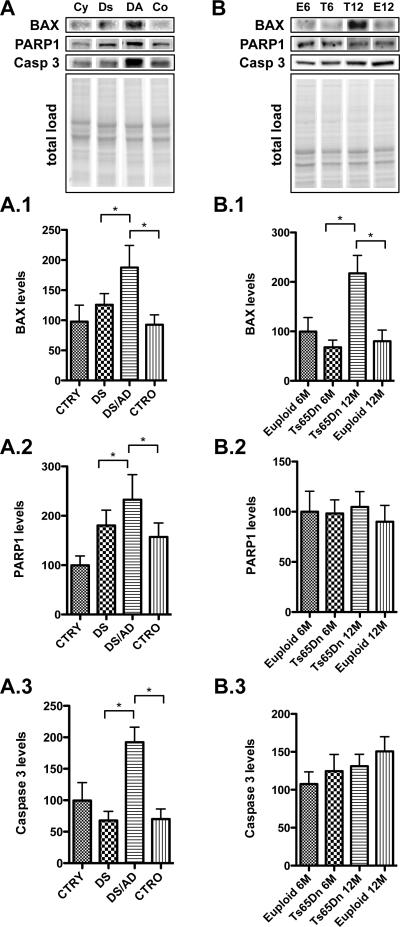
Figure 4. Bax, PARP1 and caspase-3 down stream targets of p53.
Proteins associated with the apoptotic pathway including bax (1), PARP1 (2) and Caspase-3 (3) levels were measured by Western Blot in the frontal cortex of controls and DS cases (Panel A) and in the frontal cortex of Ts65Dn mice at 6 and 12 months of age compared to age-matched euploid animals (Panel B). Densitometric values shown in the bargraph are the mean of 8 samples per group normalized per total protein load and are given as percentage of control, set as 100%. On the top a representative blot image with protein bands is shown (*p < 0.05).

