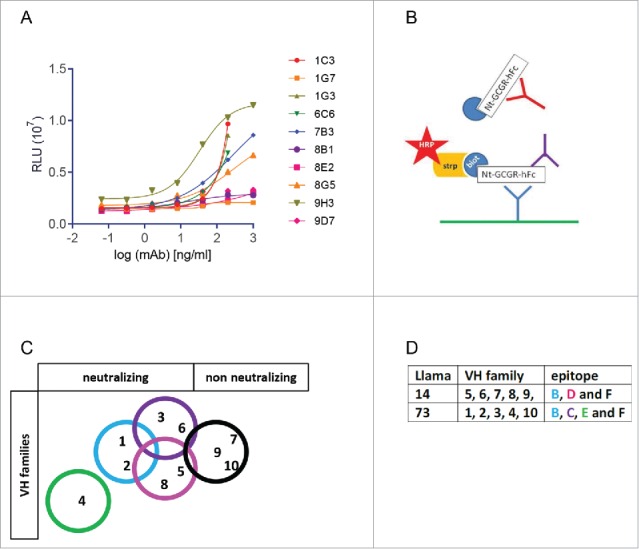
Figure 4.

Glucagon-induced cAMP activity assay and epitope mapping of mAbs. (A) Inhibition of glucagon-induced cAMP activity by serially diluted mAbs, expressed as Relative Luminescence Units (107 RLU). Binding of GCGR-specific mAbs on GCGR-overexpressing CHO cells analyzed by fluorescence-activated cell sorting. (B) Schematic epitope overview, analyzed by competition assay. Biotinylated mAbs were allowed to bind coated ECD-GCGR in competition with a 50-fold excess of unbiotinylated mAb. (C) Overview of epitope coverage by the VH families in a Venn diagram and (D) in a table.
