
Figure 2.
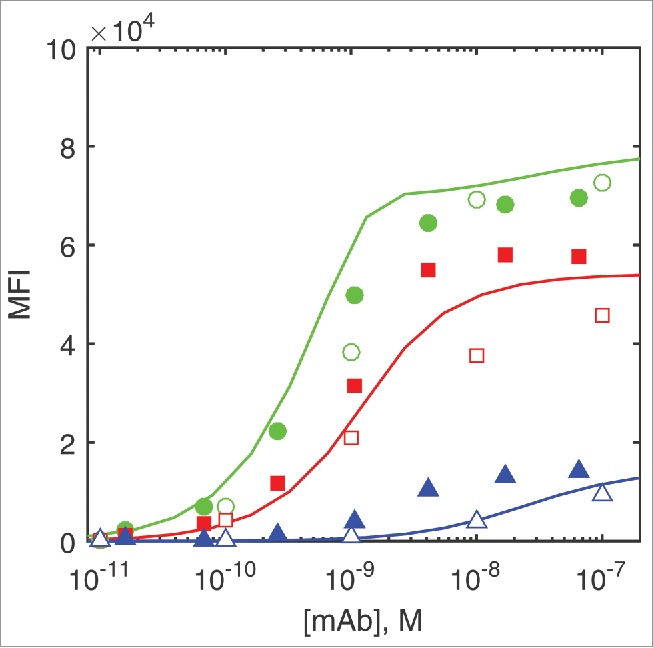
The experimentally measured and predicted binding of the parent DuetMab in flow cytometry assay. Filled circles, squares and triangles are experimental data measured by Mazor et al.6 for CD4+/CD70+, CD4+/CD70− and CD4−/CD70+ cells, respectively. Empty symbols represent Monte Carlo simulation results and the lines are the ODE simulation results for the same cell types, respectively.