
Figure 3.
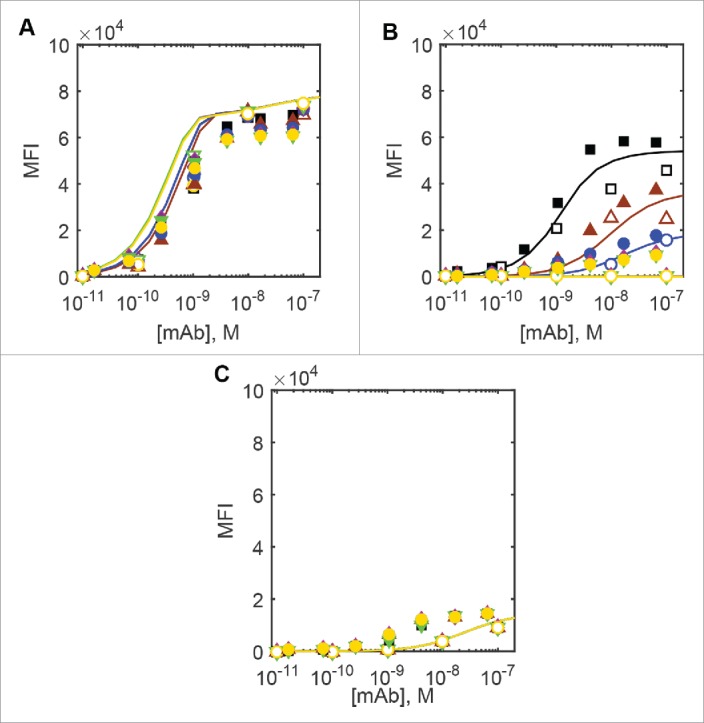
Experimental and predicted flow cytometric cell binding curves for the parent and modified DuetMabs. Black squares, brown triangles pointing up, blue circles, green triangles pointing down, purple diamonds and yellow circles denote parent DuetMab and the anti-CD4 affinity attenuated variants VkY92A, VkY91A, VkR95A, VkR95A+VhD97A and VkR94A+VhD97A. Filled symbols denote the experimental data measured by Mazor et al.,6 and empty symbols Monte Carlo simulation results. Lines denote ODE simulation results in the same order. A) dual-positive CD4+/CD70+ cells, B) single-positive CD4+/CD70− cells and C) single-positive CD4−/CD70+ cells.