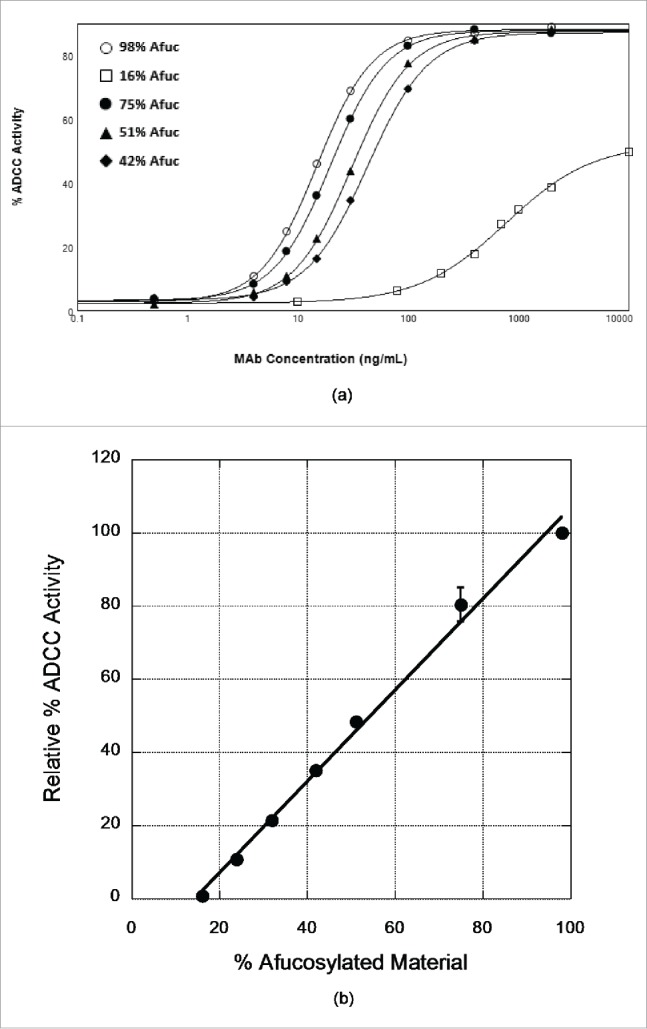
Figure 3.

Dependence of ADCC activity of x-huCD20.hIgG4 on afucosylation levels. (A) ADCC curves observed for samples prepared by blending CHO-produced and Fut8KO-CHO-produced antibody. The results shown are mean values of duplicate wells from one representative plate of an ADCC assay. (B) Relationship of ADCC activity calculated from ADCC curves to the % afucosylation. Data presented are normalized mean ADCC activity values, assigning the 98% afucosylated sample as ADCC activity of 100%. The line is the result of a linear least squares analysis of the relative % ADCC data with correlation coefficient R = 0.99; error bars represent corresponding standard error of the mean and in most cases are smaller than the data point symbol.
