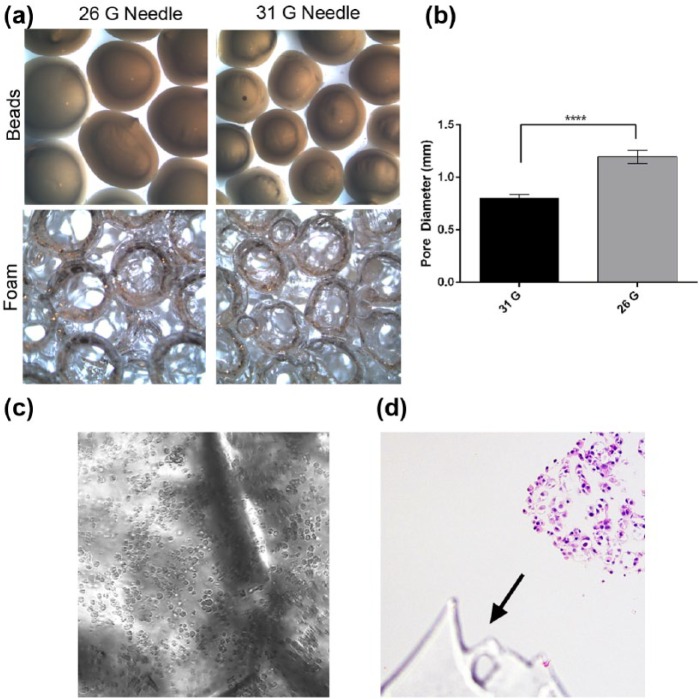
Figure 3.
Generation of PDMS foam. (a) Photographs depicting alginate beads (top) and consequent pore size of the PDMS foam (bottom) when 31- and 26-G needles are used to make the beads. (b) Graphical comparison of pore diameter within the foam when 31- and 26-G needles are used to make the alginate beads. Data are the mean and SEM, unpaired t-test, ****p ⩽ 0.0001. (c) Photomicrograph of 231 cells and ECM within PDMS foam (brightfield microscopy, 200× original magnification). (d) Photomicrograph of an H&E-stained histologic section of a surrogate showing PDMS on the histologic section (arrow, 200× original magnification).

