Figure 7.
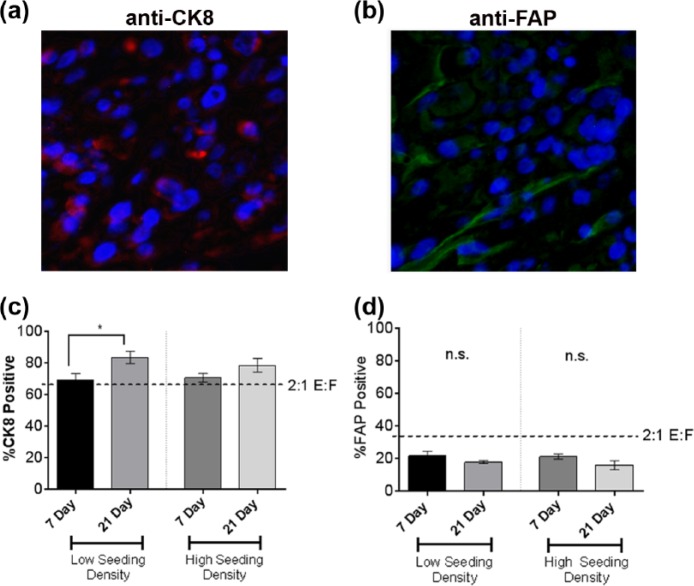
Epithelial to fibroblast ratio (E:F) following growth in the perfusion bioreactor system. (a) Representative photomicrograph of the CK8 immunofluorescence (IF) staining, marking epithelial cells with red fluorescence in the cytoplasm. Cells labeled red tend to cluster together, indicating epithelial cell aggregation. (b) Representative photomicrograph of the FAP IF staining, marking the cytoplasm of the CAF with green fluorescence (top panel). The green cytoplasm of the CAF in most cells is elongate, typical of fibroblast morphology. The CAF are interspersed among groups of non-labeled, clustering cells. (c) The percentage of CK8-positive cells following 7 or 21 days growth in the perfusion bioreactor system when surrogates were set up at low or high cell seeding densities (unpaired t-test,*p ⩽ 0.05). (d) The percentage of FAP-positive cells following 7 or 21 days growth in the perfusion bioreactor system when surrogates were set up at low or high cell seeding densities (n = 4 surrogates at each time point and seeding density in c and d). Data in c and d are the mean and SEM.

