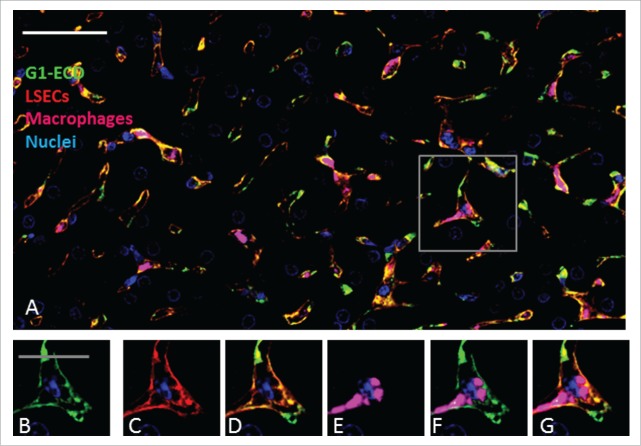
Figure 6.
Immunohistochemistry analysis of BsAb G1-ECD in cynomolgus monkey liver shows co-localization with LSEC marker but less with liver macrophages (Kupffer cells). In panels A-G, green, blue, red and magenta represent detection of BsAb, hepatocyte nuclei, LSECs and macrophages (Kupffer cells), respectively. (A) Multi-channel immunofluorescence image with detection of G1-ECD, LSECs, Kupffer cells and hepatocyte nuclei. The boxed area in Panel A shows the area from which the higher magnification insets B-G are derived. (B) G1-ECD detection using an anti-human IgG (Bethyl Laboratories A80–319A); (C) detection of the endothelial cell marker CD31/PECAM1 (R&D Systems AF806); (D) overlay of the G1-ECD and CD31 detection signals; (E) detection of the resident macrophage marker CD68 (ThermoFischerScientific MA5–13324); (F) overlay of the G1-ECD and CD68 detection signals; (G) multi-channel overlay image of all the insets. Data are from representative liver sections from a single cynomolgus monkey at 6 hours post administration. The scale bar for Panel A represents 50 μm, whereas the scale bars for the inset Panels B-G represents 20 μm.

