
Figure 6.
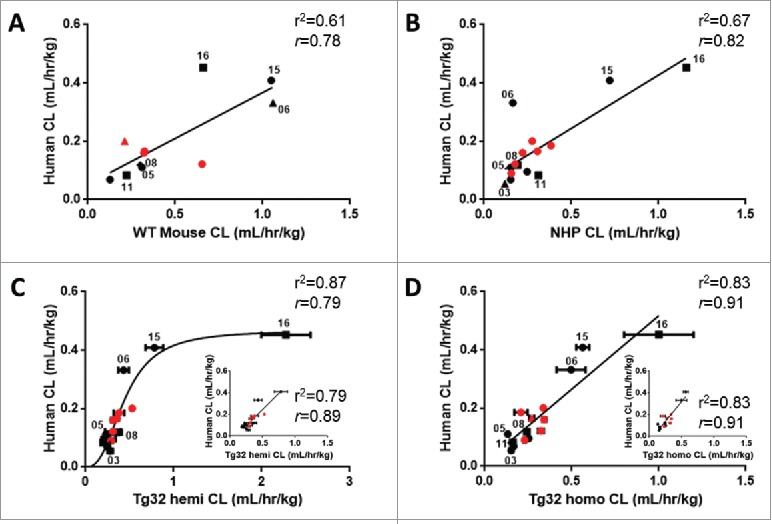
Correlation of mAb CL in Rodents vs Human and NHP vs Human. Linear correlation graphs of (A) WT mouse CL to human CL for 11/27 mAbs, (B) NHP CL to human CL for 15/27 mAbs, (C) Tg32 hemizygous CL to human CL for 15/27 mAbs and D) Tg32 homozygous CL to human CL for 15/27 mAbs. MAbs shown in panels B, C, and D represent the same 15 mAbs. Tg32 mouse CL results are shown as the mean ± standard deviation for 3-6 animals/group. Symbols: • , definitive linear CL values; ▴, apparent linear CL in rodent or NHP; ▪apparent linear CL in human; ♦, apparent linear CL in rodent or NHP and human. •, Pfizer mAbs, , marketed therapeutic mAbs.