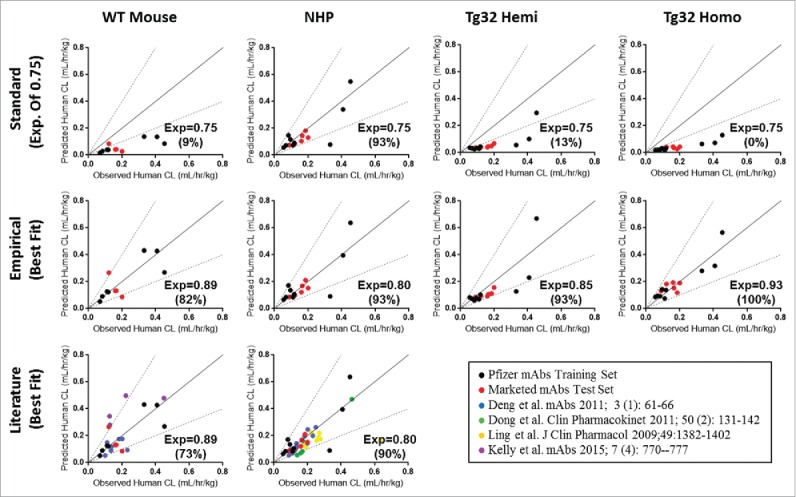
Figure 7.

Single Species Allometric Scaling of CL for mAbs. Allometric Scaling for mAbs in NHP (15/27mAbs), WT mice (11/27mAbs), and hFcRn Tg32 hemizygous and homozygous mice (15/27 mAbs), comparing a standard scaling exponent of 0.75 (top row) to an empirically derived best fit exponent (middle row) per animal model. Results are plotted against a line of unity (solid black line) ± 2-fold error (dotted gray lines) where accuracy is described as the percentage (%) of mAbs predicted within 2-fold of the line of unity. Symbols: • , definitive linear CL values; ▴
 , apparent linear CL in rodent or NHP; ▪
 , apparent linear CL in human; ♦
 apparent linear CL in rodent or NHP and human. •
 , training data set. , test set, marketed therapeutic mAbs.
