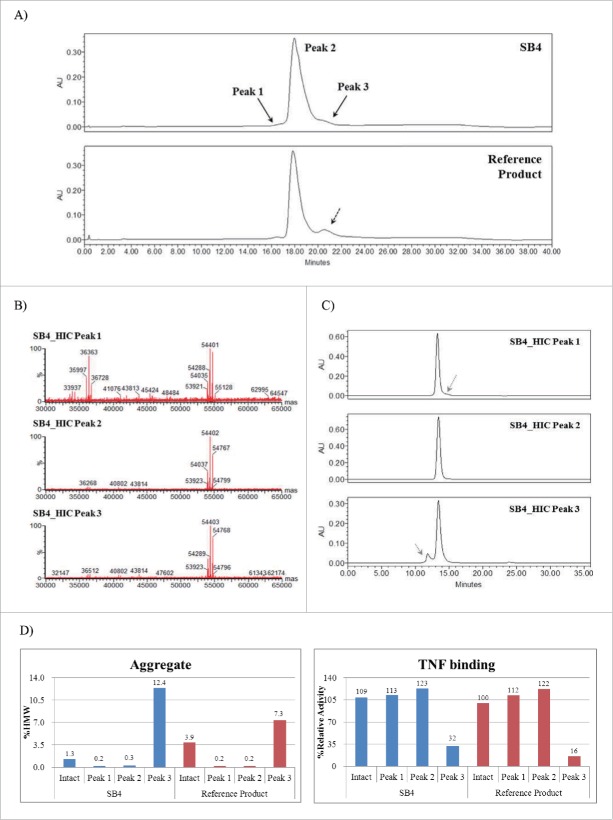
Figure 6.
Structure-activity relationship (SAR) results for hydrophobic variants of SB4 and the reference product. (A) Comparative HIC chromatograms of SB4 (upper panel) and the reference product (lower panel). (B) Intact protein mass of each HIC peak. Fragmented protein (36,363 Da) was detected in Peak 1. (C) Size exclusion chromatograms for each HIC fraction of SB4. (D) Relative amounts of HMW aggregate in intact protein and HIC fractions corresponding to Peaks 1–3 and relative TNF binding activities of intact protein and each fraction of interest (Peaks 1–3).

