
Figure 7.
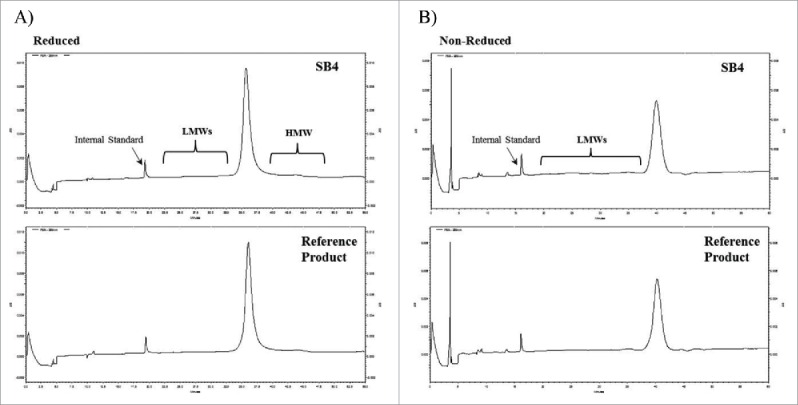
Comparison of CE-SDS electropherograms of SB4 and the reference product under reduced and non-reduced conditions. (A) SB4 (upper panel) and the reference product (lower panel) under reduced conditions. (B) The same 2 products under non-reduced conditions.