
Figure 9.
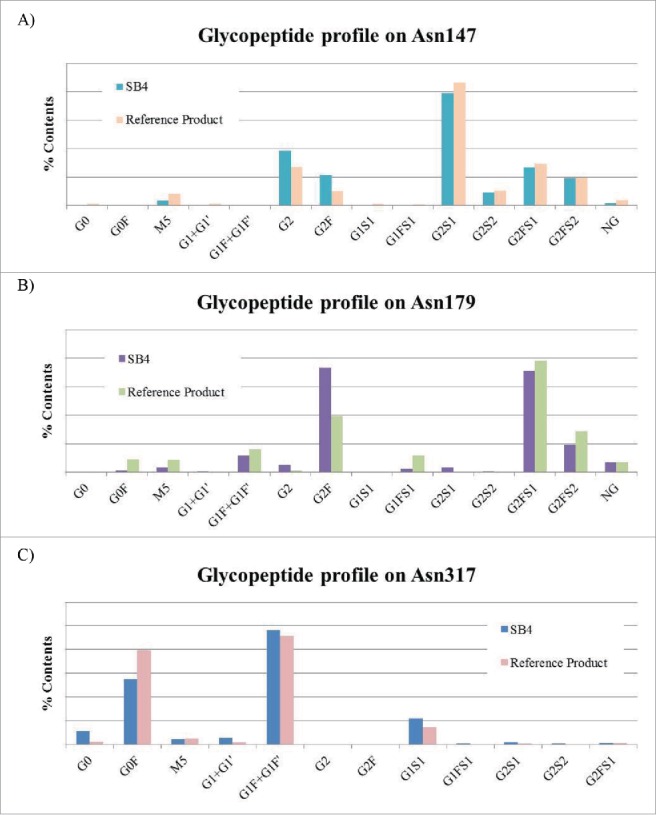
Comparison of the glycopeptide profiles. (A) Glycopeptide profile of Asn147. (B) Glycopeptide profile of Asn179. (C) Glycopeptide profile of Asn317. Results of the site-specific quantitation for the glycopeptides are shown.
Official websites use .gov
A
.gov website belongs to an official
government organization in the United States.
Secure .gov websites use HTTPS
A lock (
) or https:// means you've safely
connected to the .gov website. Share sensitive
information only on official, secure websites.
Comparison of the glycopeptide profiles. (A) Glycopeptide profile of Asn147. (B) Glycopeptide profile of Asn179. (C) Glycopeptide profile of Asn317. Results of the site-specific quantitation for the glycopeptides are shown.