
Figure 10.
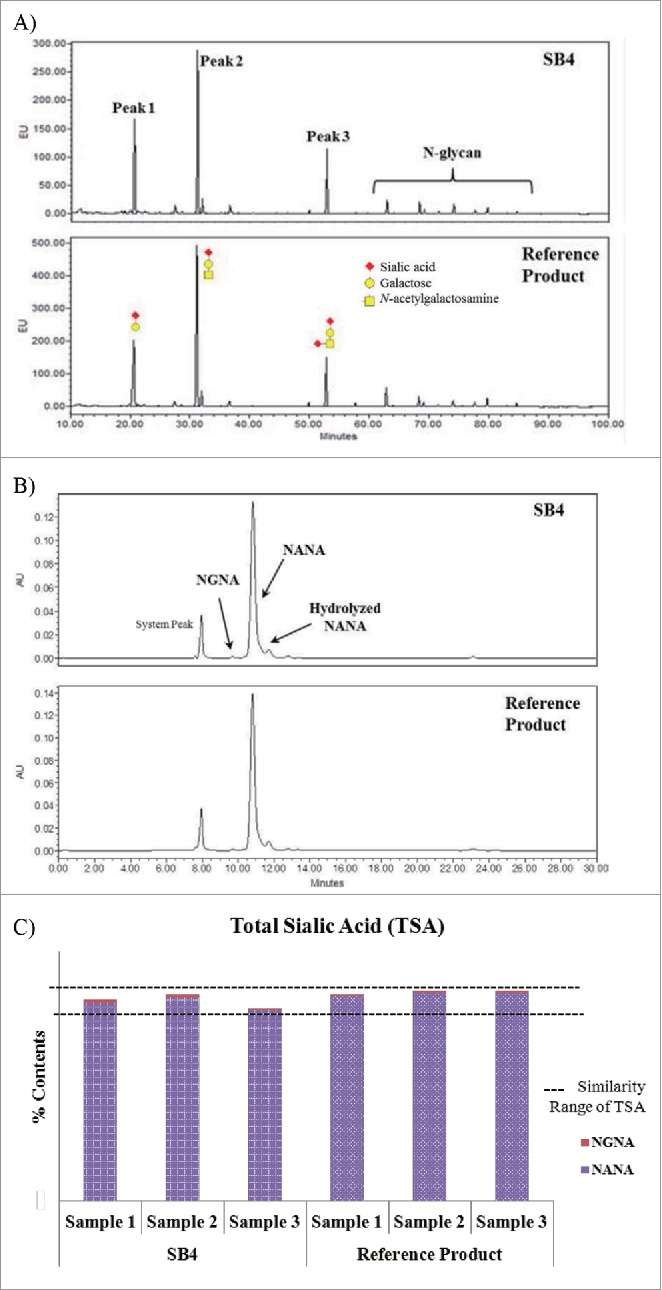
Comparison of O-glycan profiles, TSA chromatograms, and TSA content of SB4 and the reference product. (A) HILIC chromatograms of 2-AB–labeled O-glycan species of SB4 (upper panel) and the reference product (lower panel). (B) Ion exclusion chromatography of sialic acid moieties of SB4 and the reference product. (C) Graphical comparison of TSA content of SB4 and the reference product.