
Figure 12.
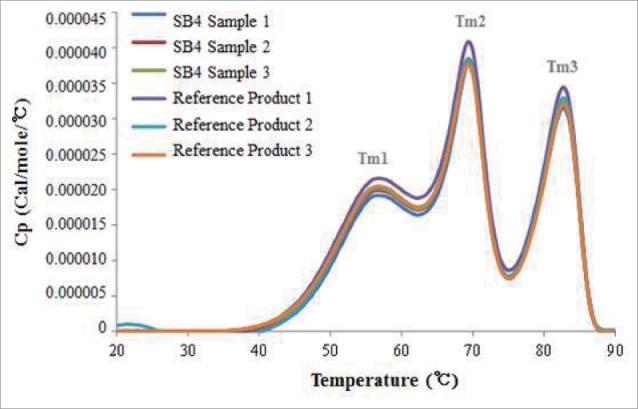
Thermograms from differential scanning calorimetry. Comparative thermograms of SB4 and the reference product show 3 similar, distinctive melting points (Tm).
Official websites use .gov
A
.gov website belongs to an official
government organization in the United States.
Secure .gov websites use HTTPS
A lock (
) or https:// means you've safely
connected to the .gov website. Share sensitive
information only on official, secure websites.
Thermograms from differential scanning calorimetry. Comparative thermograms of SB4 and the reference product show 3 similar, distinctive melting points (Tm).