
Figure 13.
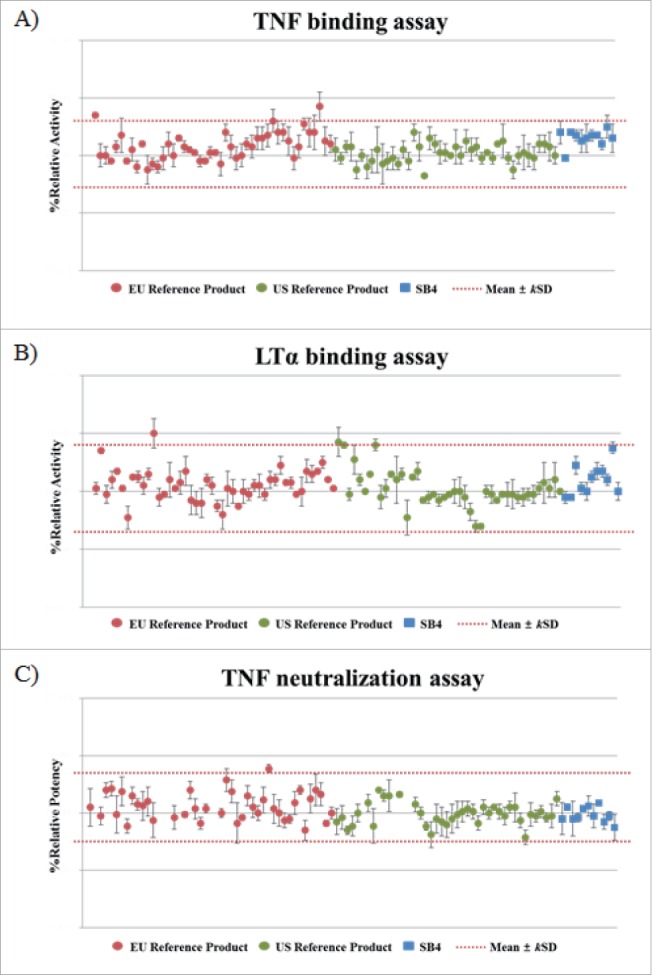
Comparison of the biological activities of SB4 and the reference product obtained from the EU and US reference product. (A) Relative TNF binding activity as shown by FRET assays. (B) Relative LTα binding activity as shown by FRET assays. (C) Relative potency as indicated by a TNF neutralization assay. The dotted line indicates the similarity range (mean±kSD) based on results of etanercept obtained from the EU.