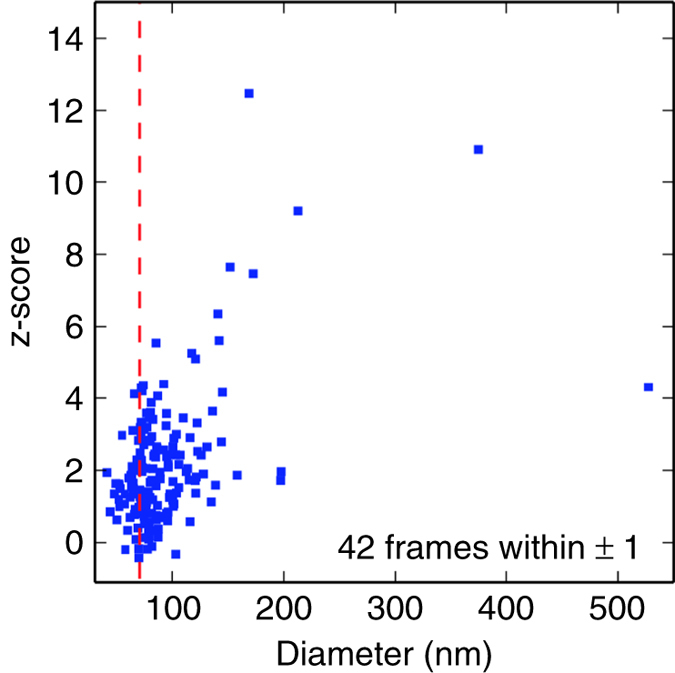
Figure 7. Front detector normalized surprise (z-score) versus back detector particle size fits.

The dashed red line indicates the diameter (70.8 nm) of the RDV model. The normalized surprise function, or its z-score, measures the agreement of the data with a known model: The data are inconsistent with the model when the absolute value of the z-score is much greater than unity: a z-score much greater than unity is consistent with the data being ‘surprising’ given the assumed model.
