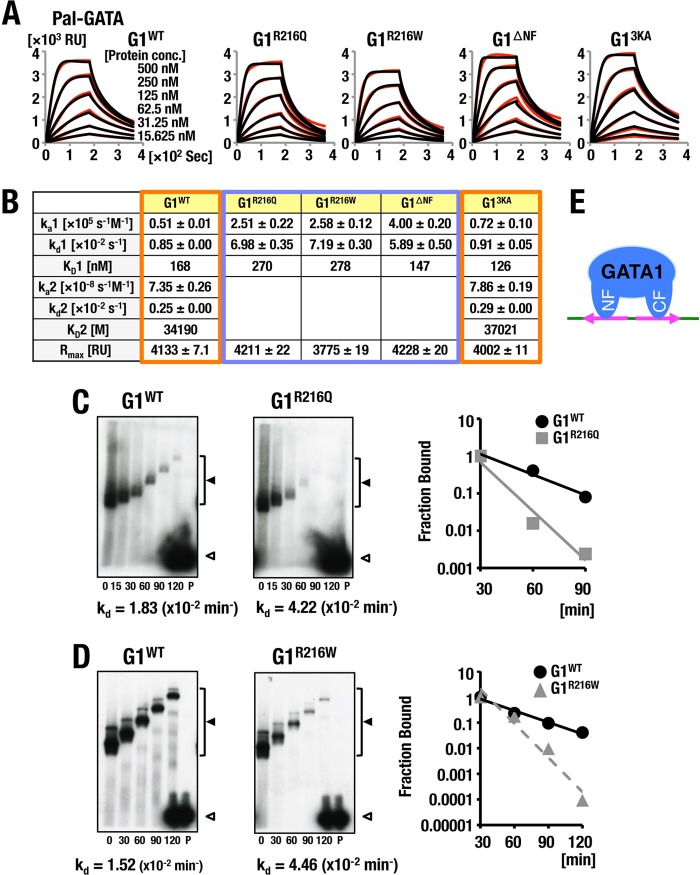
FIG 2.
Analyses of GATA1 binding to Pal-GATA. (A, B) A comparison of the influences of flow rate in indicated protein concentrations (A) and kinetics parameters (B) of the respective GATA1 proteins on the binding to Pal-GATA. Typical results acquired in two independent SPR analyses are shown. For details, see the legend to Fig. 1. (C, D) Off-rate analyses of G1R216Q (C) and G1R216W (D) in comparison with GATA1 bound to Pal-GATA. Data are representative of two independent experiments. For details, see the legend to Fig. 1. (E) Schematic diagrams of predicted binding model of GATA1 to Pal-GATA.

