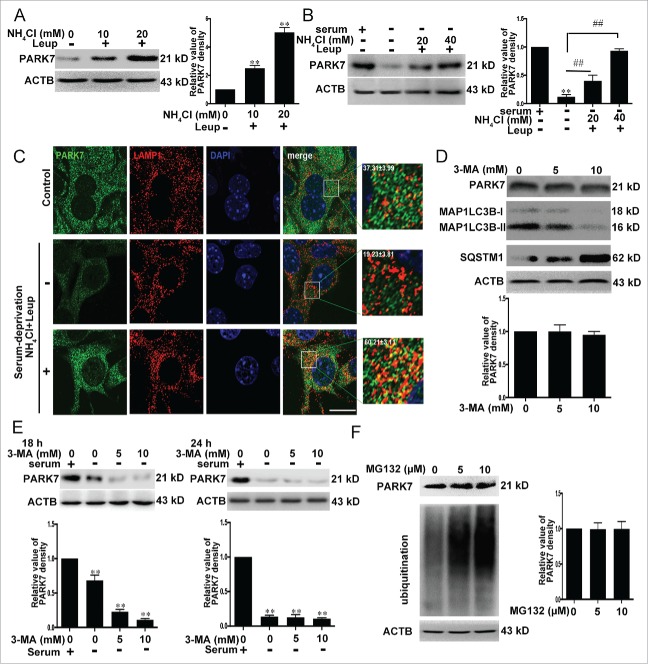
Figure 1.
Degradation of PARK7 by lysosomes. (A) The effect of inhibition of lysosomal activity on PARK7. SN4741 cells were incubated with NH4Cl and leupeptin (Leup; 100 μM used in this and subsequent experiments) for 18 h and the levels of PARK7 were analyzed by immunoblotting. The right graph shows the quantification of PARK7 levels (mean ± SEM, n = 3; **, P < 0.01 compared to the control group). (B) The effect of serum deprivation on PARK7. SN4741 cells were maintained in serum free medium in the absence or presence of NH4Cl and Leupeptin (Leup) for 24 h. The levels of PARK7 were analyzed by immunoblotting. The right graph shows the quantification of PARK7 levels (mean ± SEM, n = 3; **, P < 0.01 compared to the control group; ##, P < 0.01 compared to serum-free only group). (C) The effect of serum deprivation on PARK7 and LAMP1 colocalization. SN4741 cells were treated as described in (B). The colocalization of PARK7 and LAMP1 was determined by immunofluorescence. The magnified images were provided. The ratio of colocalization was calculated. Scale bar: 50 μm. (D) The effect of 3-MA on PARK7. SN4741 cells were treated with 3-MA for 8 h and the levels of PARK7, MAP1LC3B-I/II and SQSTM1 were tested by immunoblotting. The lower graph shows the quantification of PARK7 level (mean ± SEM, n = 3). (E) The effect of 3-MA on serum withdrawal-induced decrease of PARK7. SN4741 cells were maintained in serum-free media with or without 3-MA for the indicated time and the levels of PARK7 were detected by immunoblotting. The lower graphs show the quantification of PARK7 levels (mean ± SEM, n = 3; **, P < 0.01 compared to the control group). (F) The effect of MG-132 on the level of PARK7. SN4741 cells were treated with the proteasome inhibitor MG132 for 8 h and the levels of PARK7 were determined by anti-ubiquitin (Ub) and anti-PARK7 blotting. The right graph shows the quantification of PARK7 levels (mean ± SEM, n = 3).

