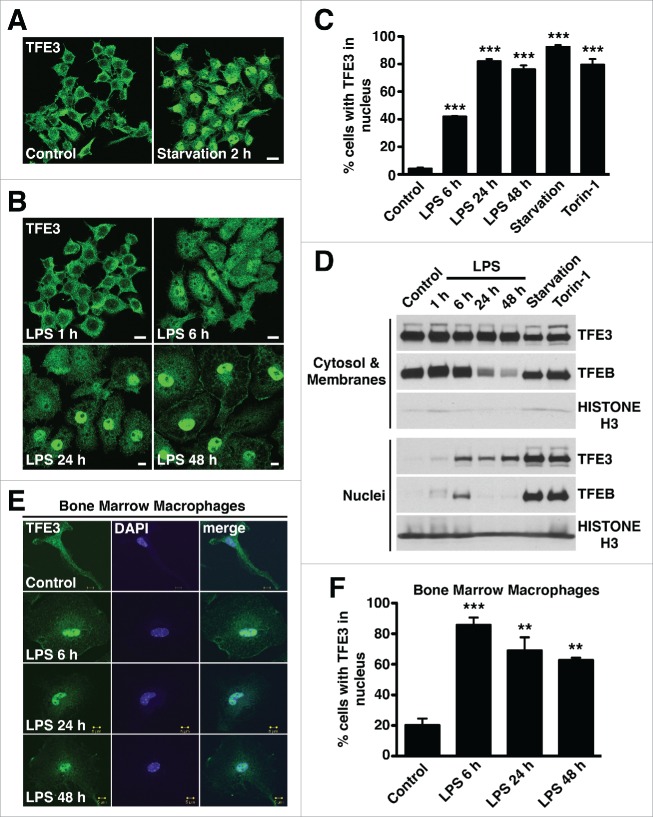
Figure 1.
Induction of TFE3 nuclear translocation in macrophages. (A) RAW 264.7 macrophages starved for 2 h in EBSS display rapid redistribution of TFE3 from the cytosol to nucleus. Scale bar: 10 µm. (B) RAW 264.7 macrophages treated with LPS exhibit a slow and sustained redistribution of TFE3 from the cytosol to nucleus. Nuclear localization peaks by 24 h and is maintained up to 48 h after treatment. Scale bar: 10 µm. (C) Quantification of TFE3 nuclear translocation from panels (Aand B). Treatment with Torin-1 for 3 h served as a positive control for nuclear translocation. *** denotes P value < 0.001 by one-way ANOVA analysis (n = 4, >300 cells per trial). (D) Nuclear-cytoplasmic fractionation of TFE3 and TFEB in Raw 264.7 macrophages. Western blots indicating total TFE3 and TFEB levels in whole cell lysates as well cytosolic/membrane fractions and nuclear fractions. TFE3 is undetectable in the nuclei of untreated cells. Starvation in EBSS for 2 h or treatment with Torin-1 for 3 h induces an increase in TFE3 detectable in the nuclear fraction whereas LPS treatment from 6 to 48 h induces a relatively lower level of nuclear TFE3. Histone H3 serves as specific marker of nuclear fraction. (E) Mouse primary bone marrow macrophages exhibit redistribution of TFE3 from the cytosol to nucleus in response to LPS stimulation. TFE3 translocates to the nucleus by 6 h and is sustained for up to 48 h. Scale bar: 5 µm. (F) Quantification of TFE3 nuclear translocation from panel (E). *** denotes P value < 0.001, and **< 0.01 by one-way ANOVA analysis (n = 3, >390 cells per trial).

