
Figure 3.
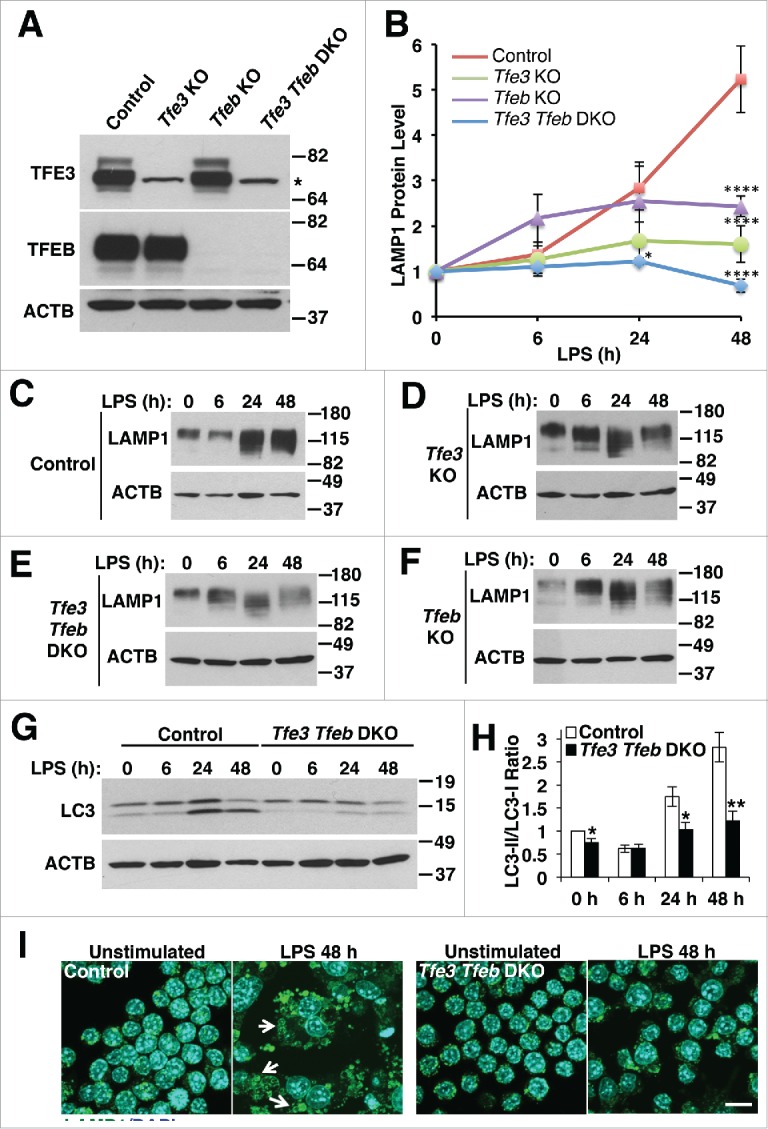
TFE3 and TFEB promote lysosome biogenesis and autophagosome formation in RAW 264.7 macrophages in response to LPS treatment. (A) RAW 264.7 macrophage Tfe3 KO, Tfeb KO and Tfe3 Tfeb double knockout (DKO) clones generated using CRISPR-Cas9 lentiviral transduction. Western blots of individual clones indicate the specificity of the KO cells. * indicates nonspecific cross-reacting band. (B) Relative LAMP1 protein levels quantified from western blots in panels C to F. LAMP1 levels normalized to actin loading control for each experiment. * denotes statistical significance, **** indicates highly significant result compared to control as determined by 2-way ANOVA with the Tukey multiple comparisons test. ((C)to F) Representative western blots of LAMP1 protein levels induced by (C) control, (D) Tfe3 KO, (E) Tfe3 Tfeb DKO, and (F) Tfeb KO clones of RAW 264.7 macrophages treated with LPS for 6 to 48 h. (G) Representative western blot of LC3-I and LC3-II levels in control and Tfe3 Tfeb DKO RAW 264.7 macrophages treated with LPS for 6 to 24 h. (H) Autophagosome formation in control and Tfe3 Tfeb DKO RAW 264.7 macrophages. Quantified by measuring ratio between LC3-II and LC3-I. * denotes P value < 0.05, and ** < 0.01 by the 2-tailed Student t test (n = 3). (I) Control, but not Tfe3 Tfeb DKO RAW 264.7 macrophages undergo distinct morphological changes in response to LPS treatment. Control cells treated with LPS for 48 h exhibit adherent and spread out cell borders and the presence of syncitia along with vacuoles and expanded LAMP1 positive structures (arrows). Scale bar: 10 µm.