Figure 1.

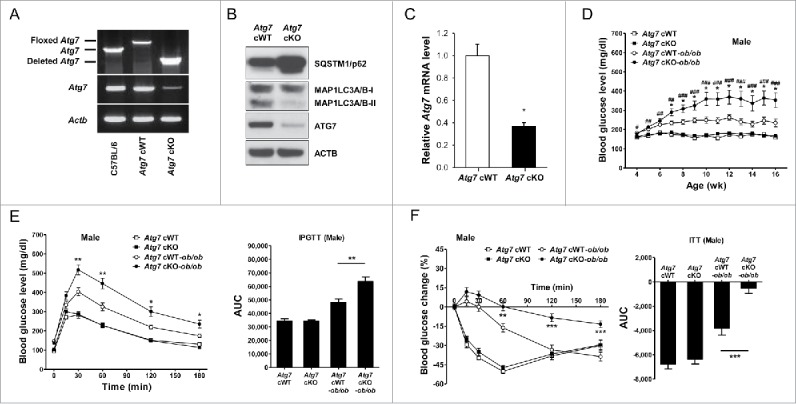
Metabolic profile of male Atg7 cKO mice. (A) PCR using DNA from peritoneal Mϕs and primers specific for Atg7. (B) Peritoneal Mϕs were cultured in serum-free conditions for 6 h to induce autophagy, and cell extracts were subjected to western blot analysis. (C) Quantitative RT-PCR was done using mRNA from Mϕs and specific primers. (D) Nonfasting blood glucose level was determined in male Atg7 cKO, Atg7 cKO-ob/ob and respective control mice (n = 10 to 15). (E) IPGTT was conducted in overnight-fasted 16-wk-old male mice as described in Materials and Methods, and AUC calculated (n = 5 to 8). (F) ITT was conducted in fasted 16-wk-old male mice as described in the Materials and Methods, and AUC calculated (n = 5 to 10). *, P < 0.05; **, P < 0.01; ***, P < 0.001.
