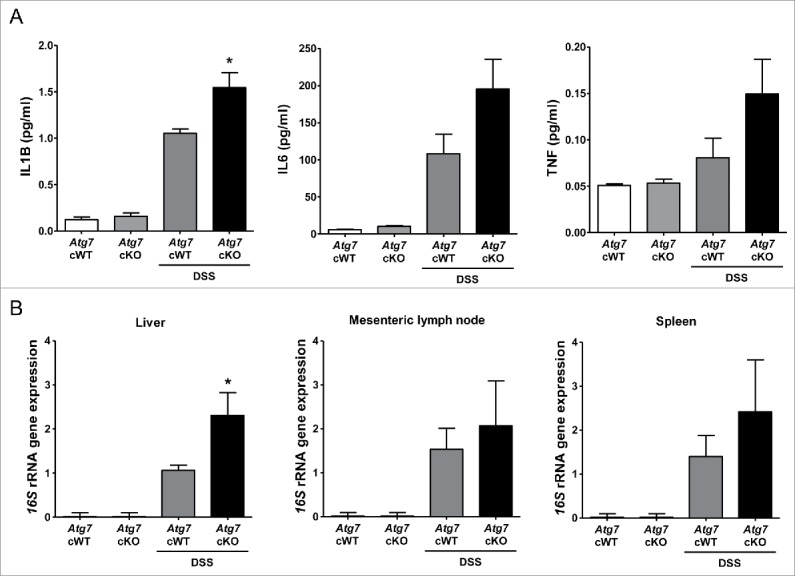
Figure 7.

Systemic inflammation and bacterial invasion after DSS treatment. (A) Serum levels of cytokines after DSS treatment were determined by ELISA (n = 6 each). (B) Relative expression of bacterial 16S rRNA genes in the liver, mesenteric lymph node and spleen determined by quantitative PCR as described in Materials and Methods (n = 9 each). *, P < 0.05.
