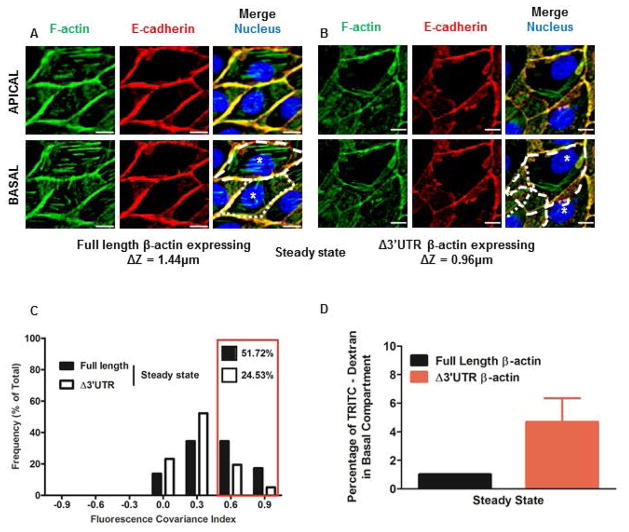
Figure 1. MDCK cells with partially mislocalized β-actin translation show adherens junction defects measured using Fluorescence Covariance Index.
(A) MDCK cells with proper localization of β-actin translation (expressing full length β-actin mRNA) fixed at steady state and immunostained for F-actin (Green), E-cadherin (Red), and Nucleus (Blue). Stress fibers are visible in the basal compartment, while E-cadherin and F-actin co-stain cell-cell interfaces in the apical and basal compartments. (B) MDCK cells with partially mislocalized β-actin translation (expressing Δ3′UTR β-actin mRNA) fixed at steady state and stained for F-actin (Green), E-cadherin (Red) and Nucleus (Blue). Lamellar overlap from neighboring cells is visible in the basal compartment although E-cadherin and F-actin still stain the cell-cell interfaces. Scale bars = 10μm. Dotted lines indicate cell boundaries and * indicates nucleus of individual cells. ΔZ represents the distance between the apical and basal planes in μm. Cells that properly localize β-actin translation (expressing full length β-actin mRNA) are taller than those with partially mislocalized β-actin translation (expressing Δ3′UTR β-actin mRNA), indicating defects in apical lifting in these cells. (C) Frequency distributions of FCI values for E-cadherin and F-actin for cells fixed in steady state (expressing full length β-actin expressing cells N = 29 cells and Δ3′UTR β-actin expressing cells N= 314 cells). Bin size = 0.3. Red box indicates the proportion of cells with high FCI values. (D) Percentage of TRITC-Dextran in the bottom compartment in an in vitro permeability assay for MDCK cells in steady state with and without partial defects in localizing β-actin translation. Bars represent Mean ± S.E.M.

