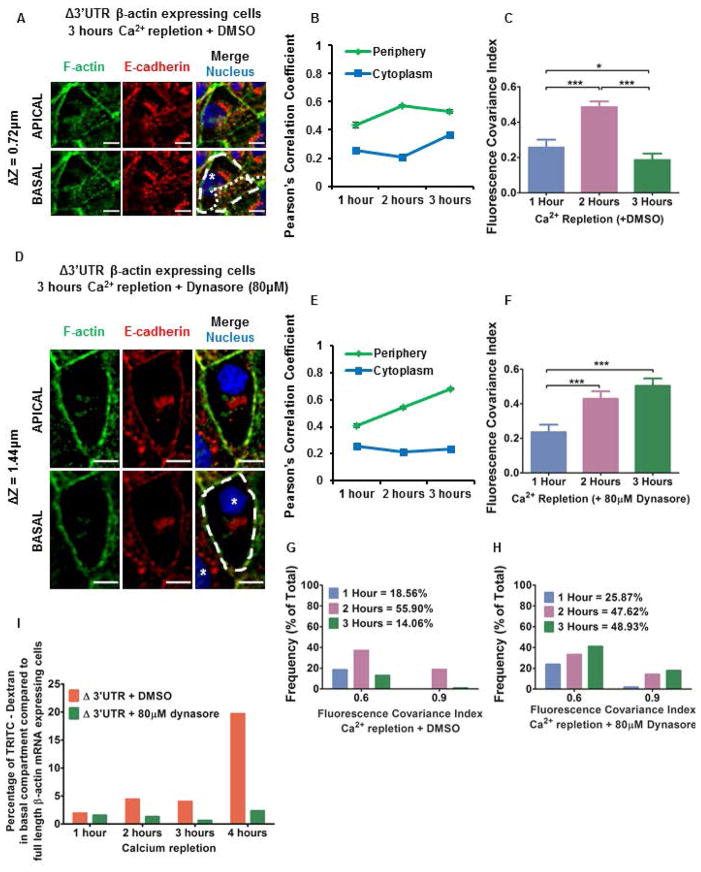
Figure 2. Inhibiting dynamin mediated endocytosis with 80μM dynasore rescues the adherens junction assembly defects caused by partially mislocalizing β-actin translation.
(A) MDCK cells with partially mislocalized β-actin translation (expressing Δ3′UTR β-actin mRNA) fixed 3 hours after calcium repletion with DMSO (0.5% v/v) and immunostained for F-actin (Green), E-cadherin (Red), and Nucleus (Blue). (B) Change in PCC values for F-actin and E-cadherin in the periphery and the cytoplasm measured for cells with partially mislocalized β-actin translation (expressing Δ3′UTR β-actin mRNA) fixed 1, 2 and 3 hours after calcium repletion with DMSO (0.5% v/v). Points represent Mean ± SEM. Note 3 hours after calcium repletion PCC values in the periphery do not increase while PCC values in the cytoplasm increase due to lamellar overlap from neighboring cells. (C) Mean FCI values. Bars represent Mean ± 95% C.I. One-way ANOVA result: p value < 0.0001. Tukey’s post-hoc multiple comparison test results with * p < 0.05, *** p < 0.0001 are indicated on the graph. (D) MDCK cells with partially mislocalized β-actin translation (expressing Δ3′UTR β-actin mRNA) fixed 3 hours after calcium repletion with 80μM dynasore and immunostained for F-actin (Green), E-cadherin (Red), and Nucleus (Blue). (A, D) Scale bars = 10μm. Dotted lines indicate cell boundaries and * indicates nucleus of individual cells. ΔZ represents the distance between the apical and basal planes in μm. Note the lamellar overlap of cells treated with 0.5% v/v DMSO. Cells treated with 80μM dynasore show no such overlap. (E) Change in PCC values for F-actin and E-cadherin in the periphery and the cytoplasm measured for cells with partially mislocalized β-actin translation (expressing Δ3′UTR β-actin mRNA) fixed 1, 2 and 3 hours after calcium repletion with 80μM dynasore. Points represent Mean ± SEM. Note 3 hours after calcium repletion PCC values in the periphery increase while PCC values in the cytoplasm remains low. (F) Mean FCI values. Bars represent Mean ± 95% C.I. One-way ANOVA result: p value < 0.0001. Tukey’s post-hoc multiple comparison test results with *** p < 0.0001 are indicated on the graph. (G) Frequency plots for high FCI values of F-actin and E-cadherin in cells with partially mislocalized β-actin translation (expressing Δ3′UTR β-actin mRNA) following calcium repletion with DMSO (0.5% v/v). 1 hour (N = 97); 2 hours (N = 229); 3 hours (N = 192). Bin size = 0.3. Note 3 hours after calcium repletion with DMSO the proportion of cells with high FCI values decreases. (H) Frequency plots for high FCI values of E-cadherin and F-actin in cells with partially mislocalized β-actin translation (expressing Δ3′UTR β-actin mRNA) following calcium repletion with 80μM dynasore. 1 hour (N = 201); 2 hours (N = 147); 3 hours (N = 112). Bin size = 0.3. Note 3 hours after calcium repletion with 80μM dynasore the proportion of cells with high FCI values is maintained indicating adherens junction recovery. (I) Percentage of TRITC-Dextran in the bottom compartment in an in vitro permeability assay for MDCK cells with partially mislocalized β-actin translation in steady state (expressing Δ3′UTR β-actin mRNA), treated with DMSO or 80μM dynasore. The bars represent values for cells with partially mislocalized β-actin translation (expressing Δ3′ UTR β-actin mRNA) relative to cells without any defects in localizing β-actin translation (expressing full length β-actin mRNA). Note treating cells with partially mislocalized β-actin translation with 80μM dynasore rescues the barrier integrity defect.

