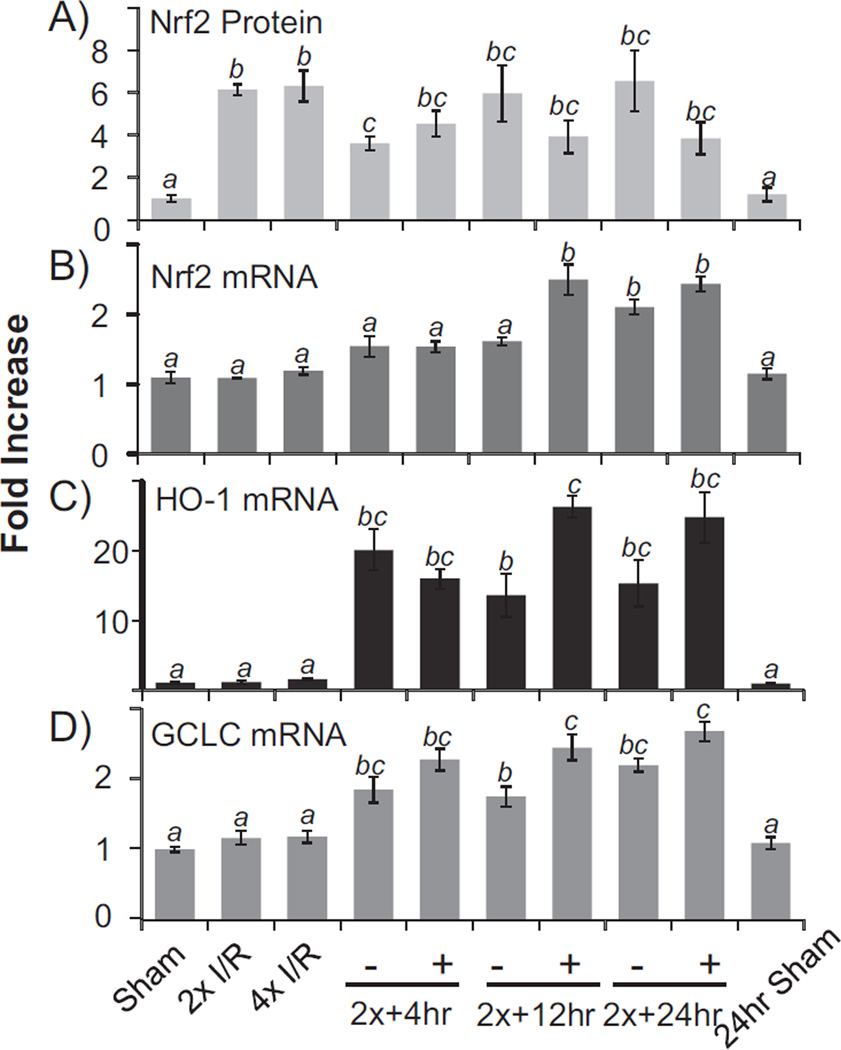
Fig. 4.
Transcription of Nrf2 downstream genes following elevation of Nrf2 protein. Mouse hearts were subjected to 2× or 4× 5′I/5′R. Immediately following 2× 5′I/5′R, the LAD coronary artery was permanently occluded for 4, 12, or 24 h for the + groups, whereas the – groups serve as sham operated controls, which had 2× 5′I/5′R but not permanent coronary artery occlusion. Tissue extracts from the whole hearts were used for Western blot (A) or harvesting total RNA for real time RT-PCR (B–D). The data represent means ± standard deviations from 3 animals. ANOVA was used to compare means and statistical differences were indicated by different letters. The means labeled “a” are significantly different from the means labeled “b”, “c” or “bc”, whereas “b” indicates significant difference of the mean from that labeled “c”. The mean labeled “bc” is not significantly different from that of “b” or “c”.

