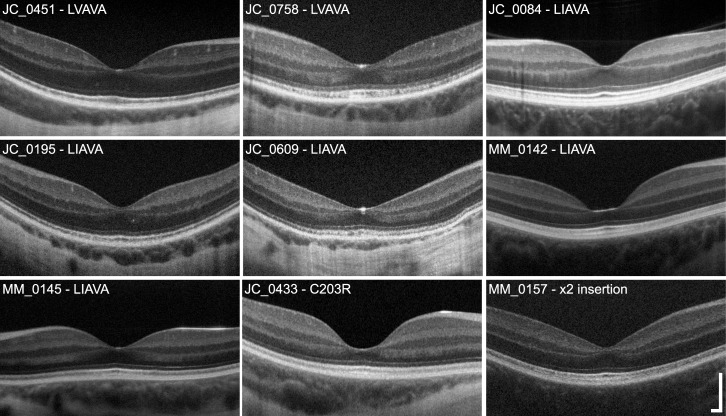
Figure 1.
Variable disruption in retinal lamination in X-linked cone dysfunction. Shown are high-resolution SD-OCT images (horizontal line scans) through the fovea. One image from each family is displayed, labeled with the subject ID and corresponding genotype. There is clear variability in ONL thickness across subjects, with MM_0142 and JC_0433 having the most pronounced ONL thinning at the fovea. Variation in foveal morphology also is apparent, which has been reported previously.64 The integrity of the second (IS/OS or EZ) and third (IZ) hyperreflective bands was variable across subjects, ranging from normal to mottled in appearance. Scale bar: 200 μm.

