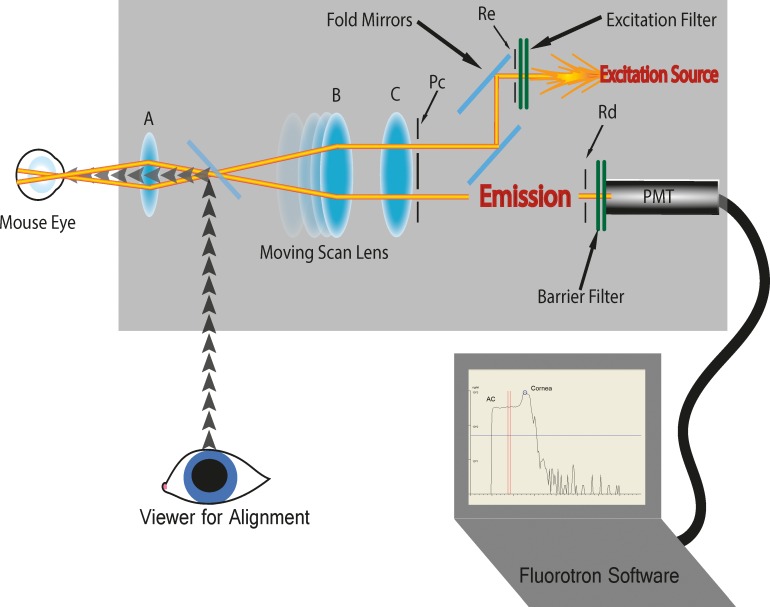
Figure 1.
Diagram of mouse fluorophotometer. The excitation source irradiates through a bandpass filter and slit aperture Re, which is imaged by the optical system as a 143 μm × 29 μm slit in the eye. Light reemitted (reflection and fluorescence) by fluorescein dye is sampled from a 143 μm × 29 μm slit, aligned to the excitation, and defined by an aperture Rd (which is confocal to Re). Lens B is used to scan Rd and Re along the optical axis. The excitation and detection pupils are defined by the apertures Pc, located very close to lens C. These pupils are imaged anterior to the animal's cornea by the optics. This configuration minimizes contributions from the fluorescence outside of the measurement point by separating the excitation and detection paths. Another bandpass filter rejects reflected excitation light, and the fluorescence collected by aperture Rd is detected using an end-on photomultiplier tube selected for low (<100 count/s) dark noise (Hamamatsu Photonics K.K., Model 647P-SELECT). Measurements are made by photon counting which yields the greatest sensitivity, signal to noise ratio, and excellent linearity.

