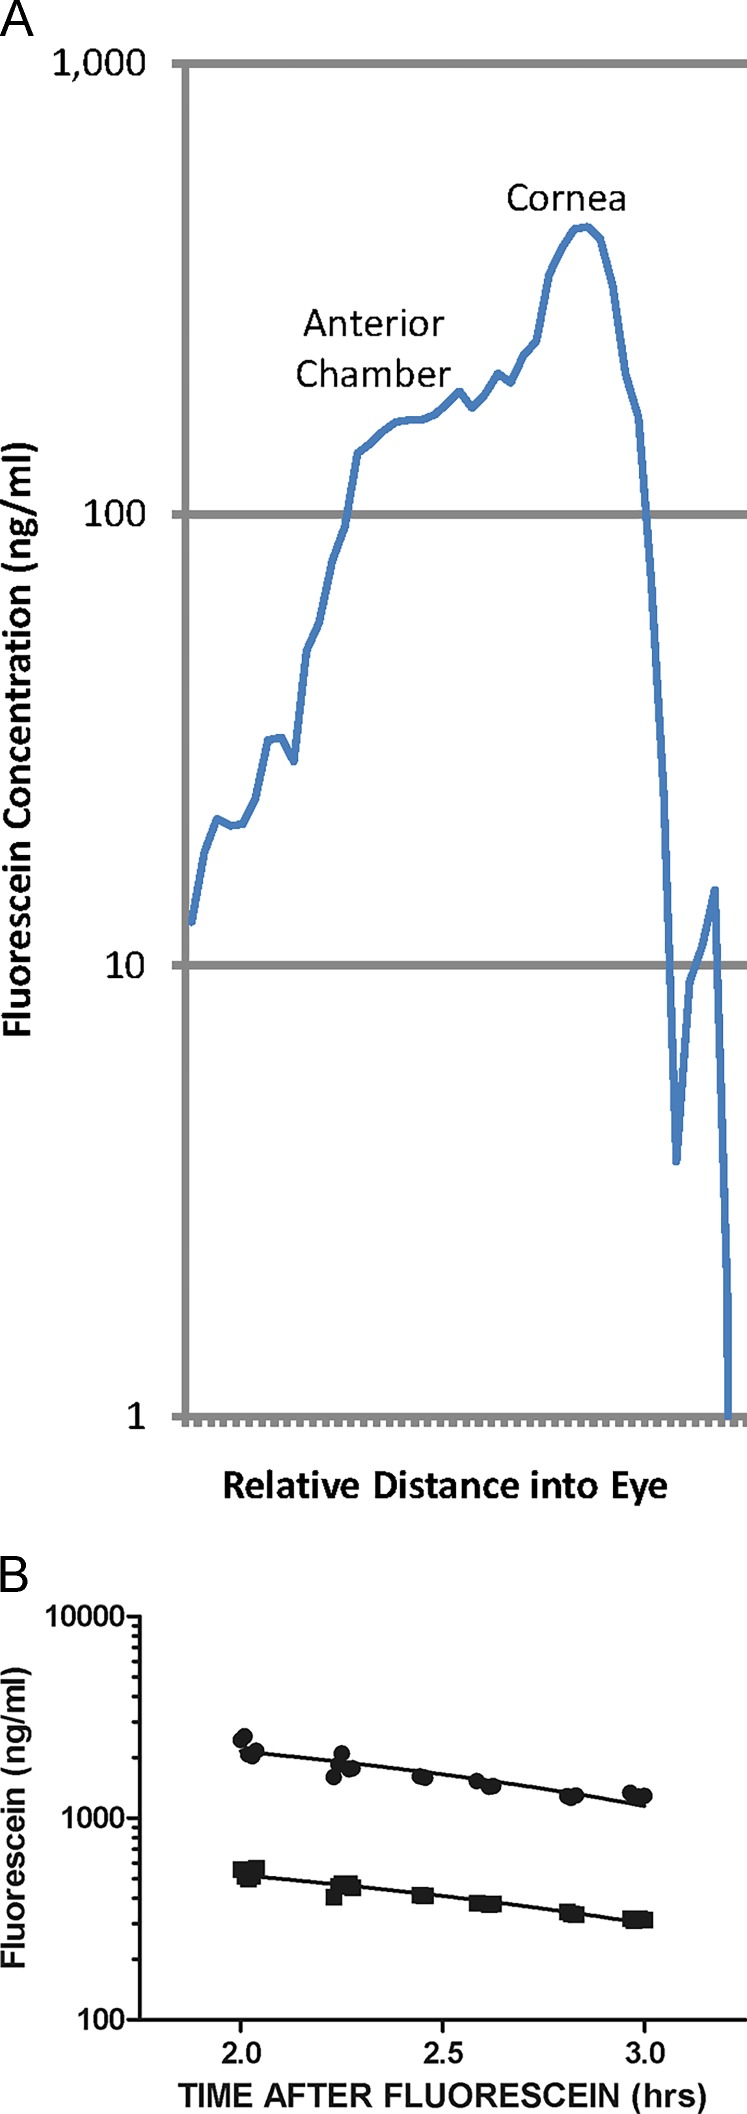
Figure 5.
Examples of fluorophotometer scans and cornea and anterior chamber decay curves of a mouse eye. (A) Scan of the mouse eye shows fluorescein distribution with characteristics very similar to those of humans and other animals. The largest peak is the cornea fluorescence taken 1 hour after fluorescein was administered topically to the cornea. The plateau to the left of the cornea peak is the anterior chamber fluorescence. The x-axis is the distance into the eye, and the y-axis is the fluorescein concentration in ng/mL. (B) Decay curves of cornea (upper curve) and anterior chamber (AC; lower parallel curve). The time of initial application of the fluorescein to the eye was 2 hours before scans commenced. The circles are cornea measurements, and the squares are the anterior chamber measurements. Good data are considered to be two parallel lines with all data falling on or very near the lines.

