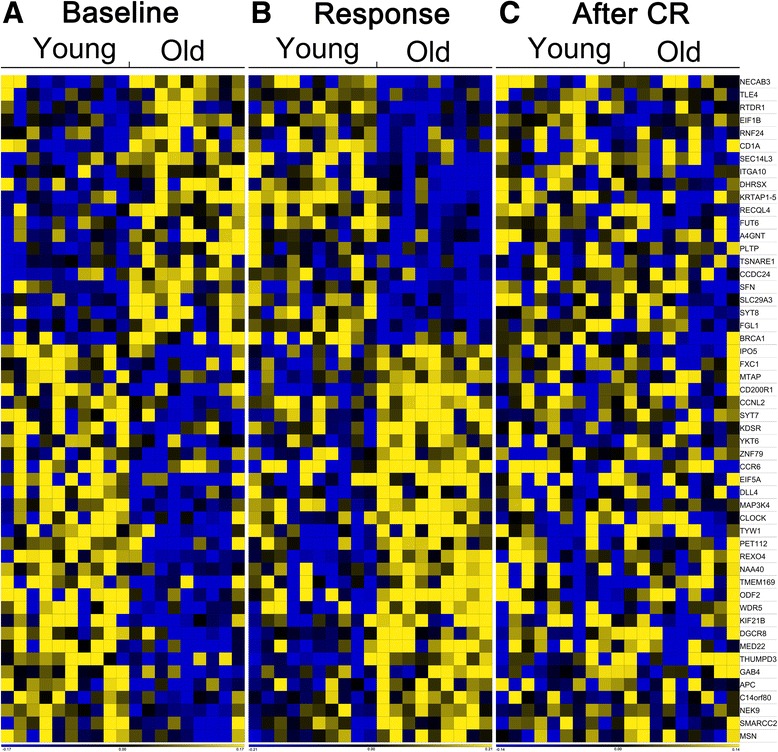
Fig. 4.

Heat map of genes of which expression changed from an old profile to a young profile upon CR. (a) baseline expression level, (b) response to CR, and (c) expression levels after CR for young and old men. Each column represents one person; each row represents one gene. Depicted are for (a) the signal log ratio calculated as gene expression values at baseline compared to the average of the whole group, for (b) the signal log ratios calculated as gene expression values upon CR compared to gene expression values at baseline, and for (c) the signal log ratios as gene expression values after CR compared to the average of the whole group.
