
Table 1.
Correlation of IPA upstream regulators between the liver, WAT, and BAT transcriptomes
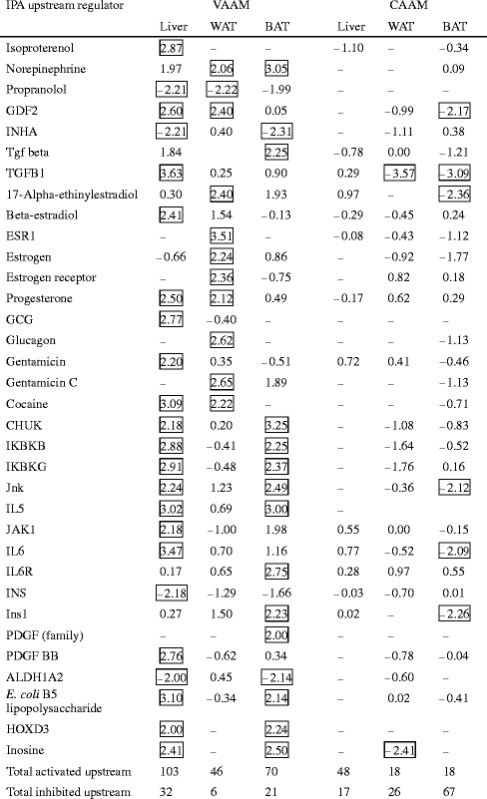
The values show the activation Z-score. The absolute Z-scores ≥2 are in squares
ALDH1A2 aldehyde dehydrogenase 1 family, member A2, CHUK conserved helix-loop-helix ubiquitous kinase, ESR1 estrogen receptor 1, GCG glucagon, GDF2 growth differentiation factor 2, HOXD3 homeobox D3, IKBKB inhibitor of kappa light polypeptide gene enhancer in B cells, kinase beta, IKBKG inhibitor of kappa light polypeptide gene enhancer in B cells, kinase gamma, IL5 interleukin 5, IL6 interleukin 6, IL6R interleukin 6 receptor, INHA inhibin, alpha, INS insulin, Ins1 insulin I, JAK1 Janus kinase 1, PDGF platelet-derived growth factor, TGFB1 transforming growth factor, beta 1