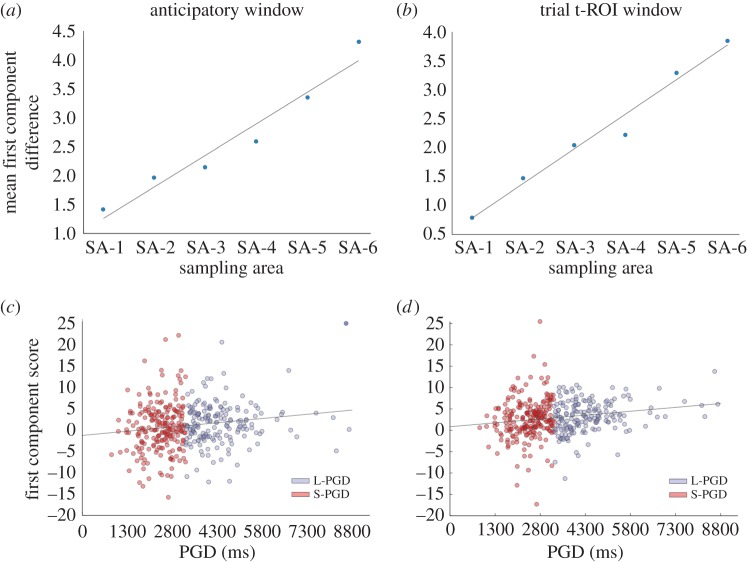
Figure 3.
Mean PCA first component score differences between L-PGD and S-PGD groups across the six sampling areas (SA), within a 200 ms anticipatory window preceding the actor face onset (a) and within the early 500 ms t-ROI window following the actor face onset (b). Mean first component score/PGD correlations related to the pupil signal in the anticipatory (c) and early t-ROI windows (d).

