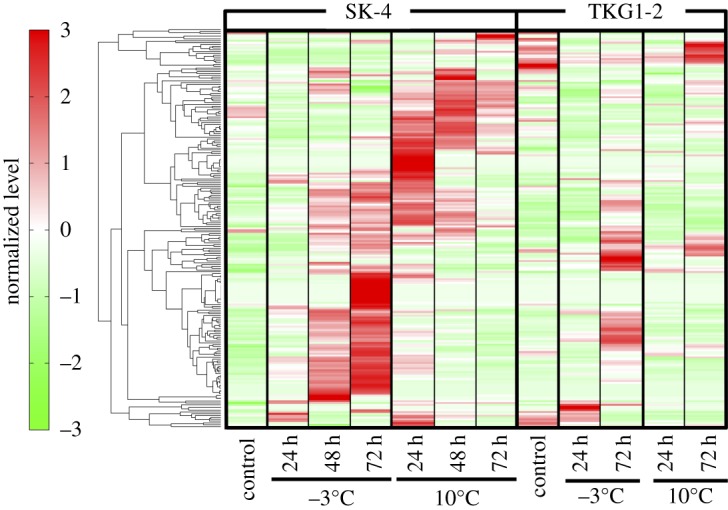
Figure 2.

Heatmap analysis of metabolites in M. blollopis SK-4 and TKG1-2. Levels of all metabolites were standardized using mean 0 and variance 1. The normalized levels are shown according to colour on the left; deep-red and green represent the most increased and decreased metabolites.
