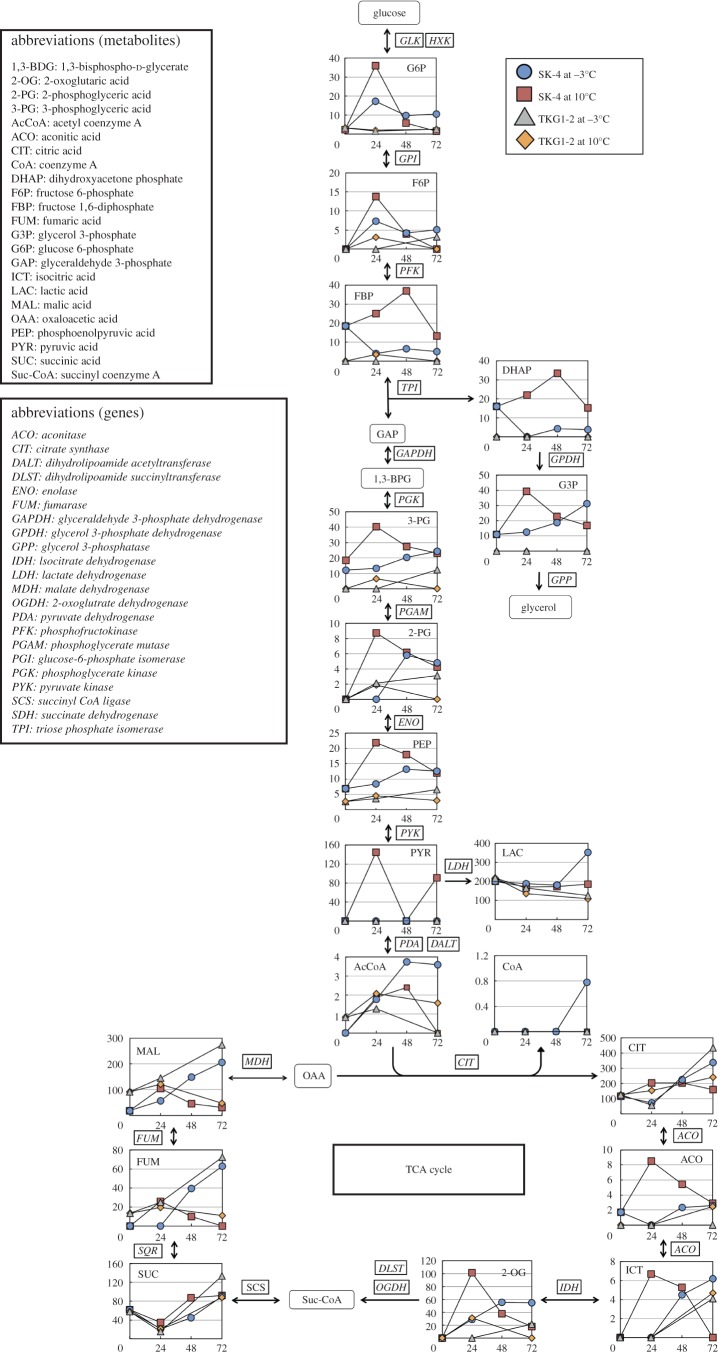
Figure 4.
Comparison of metabolites in the central carbon pathway of M. blollopis SK-4 and TKG1-2. Arrows in the figure indicate the direction of enzyme reactions. Abbreviated names of metabolites are shown in the upper left part of the figure and of enzymes are shown in the middle left in italics. The y- and x-axes represent metabolite concentration (pmol/OD600 ml) and cultivation time (h).

