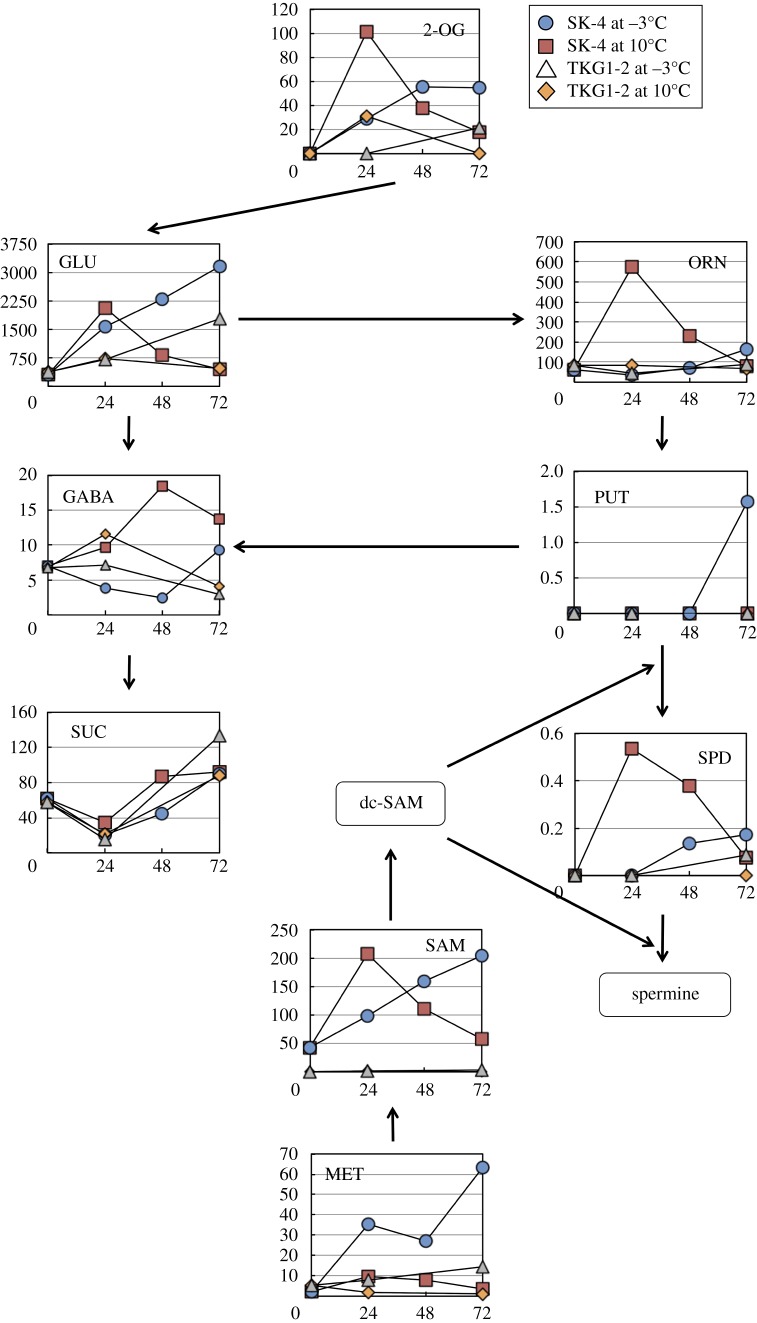
Figure 5.
Profile of metabolites in the polyamine biosynthesis pathway of SK-4 and TLG1-2. Arrows in the figure indicate the direction of enzyme reactions. The y- and x-axes represent metabolite concentration (pmol/OD600 ml) and cultivation time (h), respectively. Abbreviations: 2-OG, 2-oxoglutaric acid; dc-SAM, decarboxylated S-adenosylmethionine; GABA, 4-aminobutanoic acid; GLU, glutamic acid; MET, methionine; ORN, ornithine; PUT, putrescine; SAM, S-adenosylmethionine; SPD, spermidine; SUC, succinic acid.

