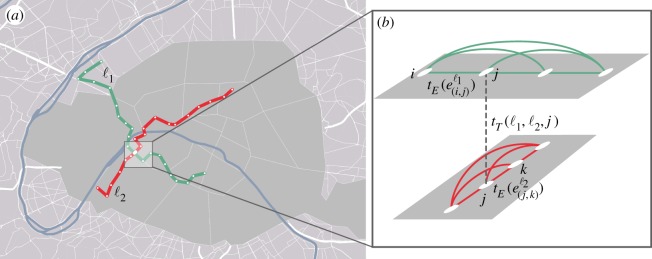
Figure 1.
Illustration of the user-based multi-edge P-space representation. (a) Two geo-localized crossing PT lines ℓ1 and ℓ2 are shown on the map of central Paris. (b) Schematic of the P-space multi-edge representation for a section of the network: all pairs of nodes corresponding to stops on the same line are connected by edges with the same label.

