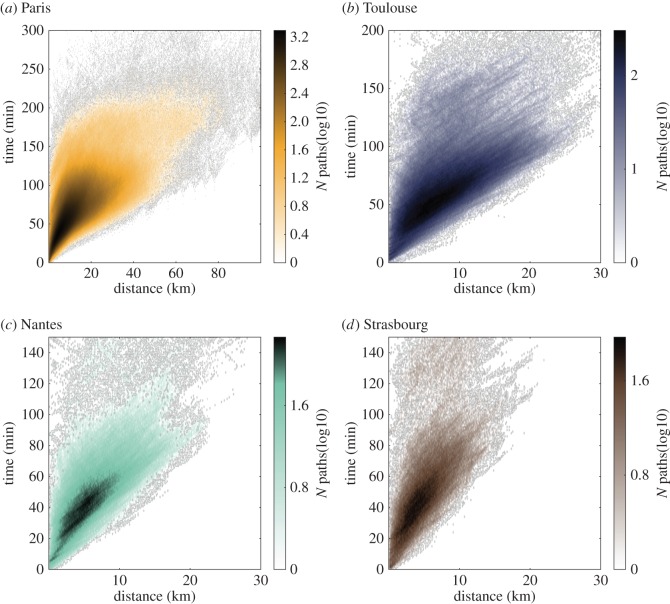
Figure 2.
Scatterplot of time versus physical distance associated with the shortest time paths for each origin–destination pair. The points are coloured according to the number of points in the area considered. Scatterplots are shown for the cities of (a) Paris, (b) Toulouse, (c) Nantes and (d) Strasbourg. Colours indicate the logarithm of the number of origin–destination pairs in a given range time–distance bin.

