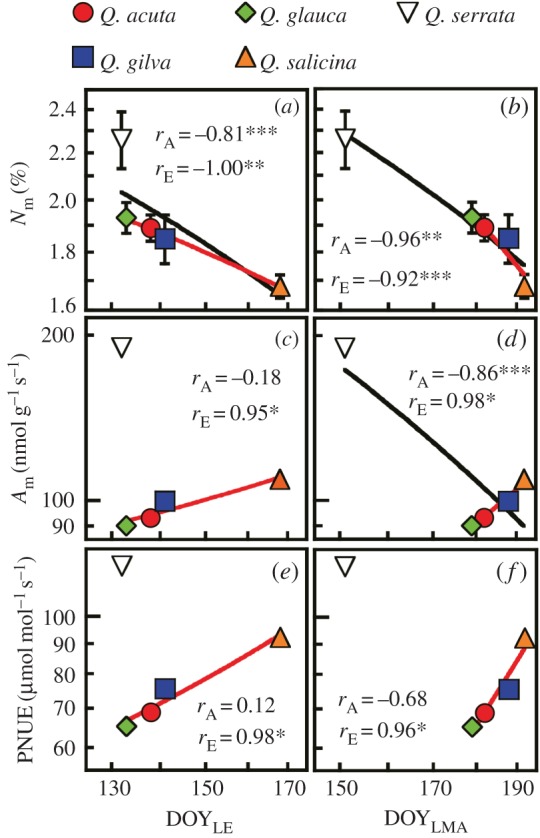
Figure 2.

Relationships of leaf physiology with the dates of full leaf expansion (DOYLE) and of the developmental completion of the leaf mass per unit area (DOYLMA). (a,b) Mass-based nitrogen content (Nm). (c,d) Mass-based photosynthetic capacity (Am). (e,f) Nitrogen-based photosynthetic capacity (PNUE). The data are shown for four evergreen (filled symbols) and a deciduous (open symbol) oak species. Evergreens with later leaf maturation had a lower leaf N content but a higher photosynthetic capacity. Note the log–log scale. The values of rA and rE represent Pearson's correlation coefficients among all of the species and among evergreen species, respectively (**p < 0.01, *p < 0.05, ***p < 0.15). The black and red lines represent regressions with p < 0.15 (as a marginally significant level) among all of the oak species and among the evergreen oak species, respectively. The bars represent ±1 s.d. (n = 7).
