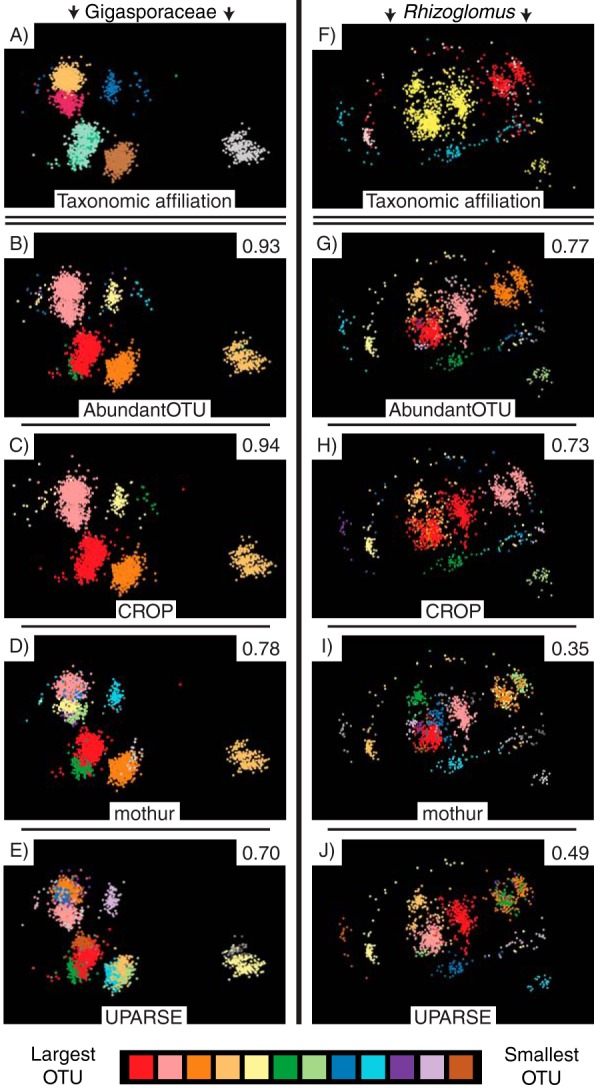
FIG 4.

MDS visualizations of OTU clusters for isolates of species of the family Gigasporaceae (left) and species of the genus Rhizoglomus (right). For both columns, the sequences (points) in the top row are colored by their species or geographic isolate affiliation (the same colors as those used in Fig. 2), and the remaining four rows (top to bottom) show the same sequences colored by OTU for each of the following four clustering methods that used the common sequence processing pipeline: AbundantOTU (second row), CROP (third row), mothur (fourth row), and UPARSE (fifth row). Only OTUs containing >10 sequences are shown, and OTUs are colored according to the number of sequences that they contain. The adjusted Rand index value in the top right corner of each panel for the clustering methods quantifies the fit of the OTU delineations compared to the known species attribution. Higher adjusted Rand index values indicate closer correspondence between each OTU and the sequences originating from each AM fungal species. All four clustering methods had closer OTU-to-species correspondence for the Gigasporaceae, with its smaller amount of within-isolate variation, than for Rhizoglomus, but for both groups, AbundantOTU and CROP consistently generated OTUs that better matched species than OTUs generated from mothur or UPARSE. Interactive three-dimensional versions of these MDS visualizations are available at https://spidal-gw.dsc.soic.indiana.edu/public/groupdashboard/AM%20fungal%20clustering%20AEM.
